1.4 Interpreting Data
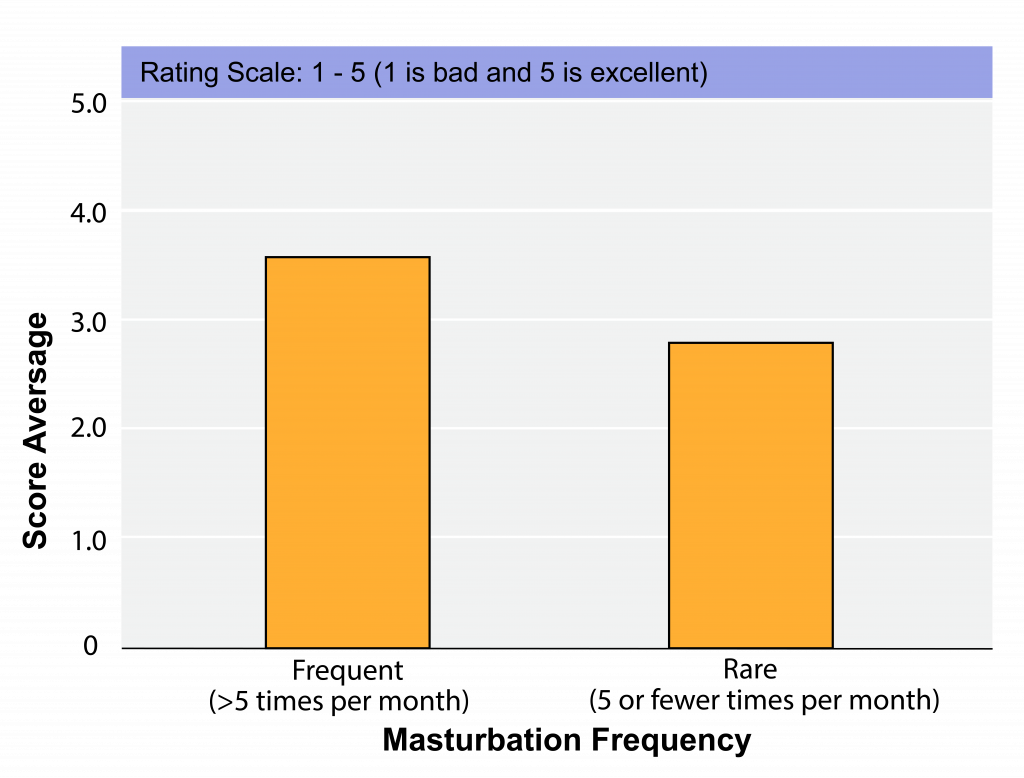
In this course, we’ll look at a lot of graphical representations of data, often combined into averages as shown below.

Now, what do you think? Can these data be used to support our hypothesis, or not? In other words, do these data meet our prediction? When you look at these data, the difference is certainly in the direction that matches our prediction, but how do we know if this difference is not just a fluke?
Scientists often use simple statistical tests to evaluate trends in their data. They can use statistical tests to determine if any observed differences, like those above, are “significant”– that is, are these differences likely to hold true if the experiment is repeated?
From hypothesis to theory
If many rounds and methods of observation and experimentation serve to support a hypothesis, these lines of evidence can create a framework called a scientific theory. Yet, even theories are subject to revision via the process of science. For this reason, we discourage use of the terms “prove” and “proven” in science.
Read More
You’ll find an excellent overview of the nature of science at http://undsci.berkeley.edu/article/intro_01.

