6.3 Life Expectancy and the Graying of Society
Learning Objectives
- Describe the differences in life expectancy around the world.
- List the potential problems associated with the growing proportion of older individuals in poor nations.
- Explain the evidence for inequality in US life expectancy.
When we look historically and cross-culturally, we see that old age is a relative term, since few people in preindustrial times or in poor countries today reach the age range that most Americans would consider to be old, say 65 or older. When we compare contemporary societies, we find that life expectancy, or the average age to which people can be expected to live, varies dramatically across the world. As Figure 6.1 “Average Life Expectancy across the Globe (Years)” illustrates, life expectancy in North America, most of Europe, and Australia averages 75 years or more, while life expectancy in most of Africa averages less than 60 years (Population Reference Bureau, 2011).
Figure 6.1 Average Life Expectancy across the Globe (Years)
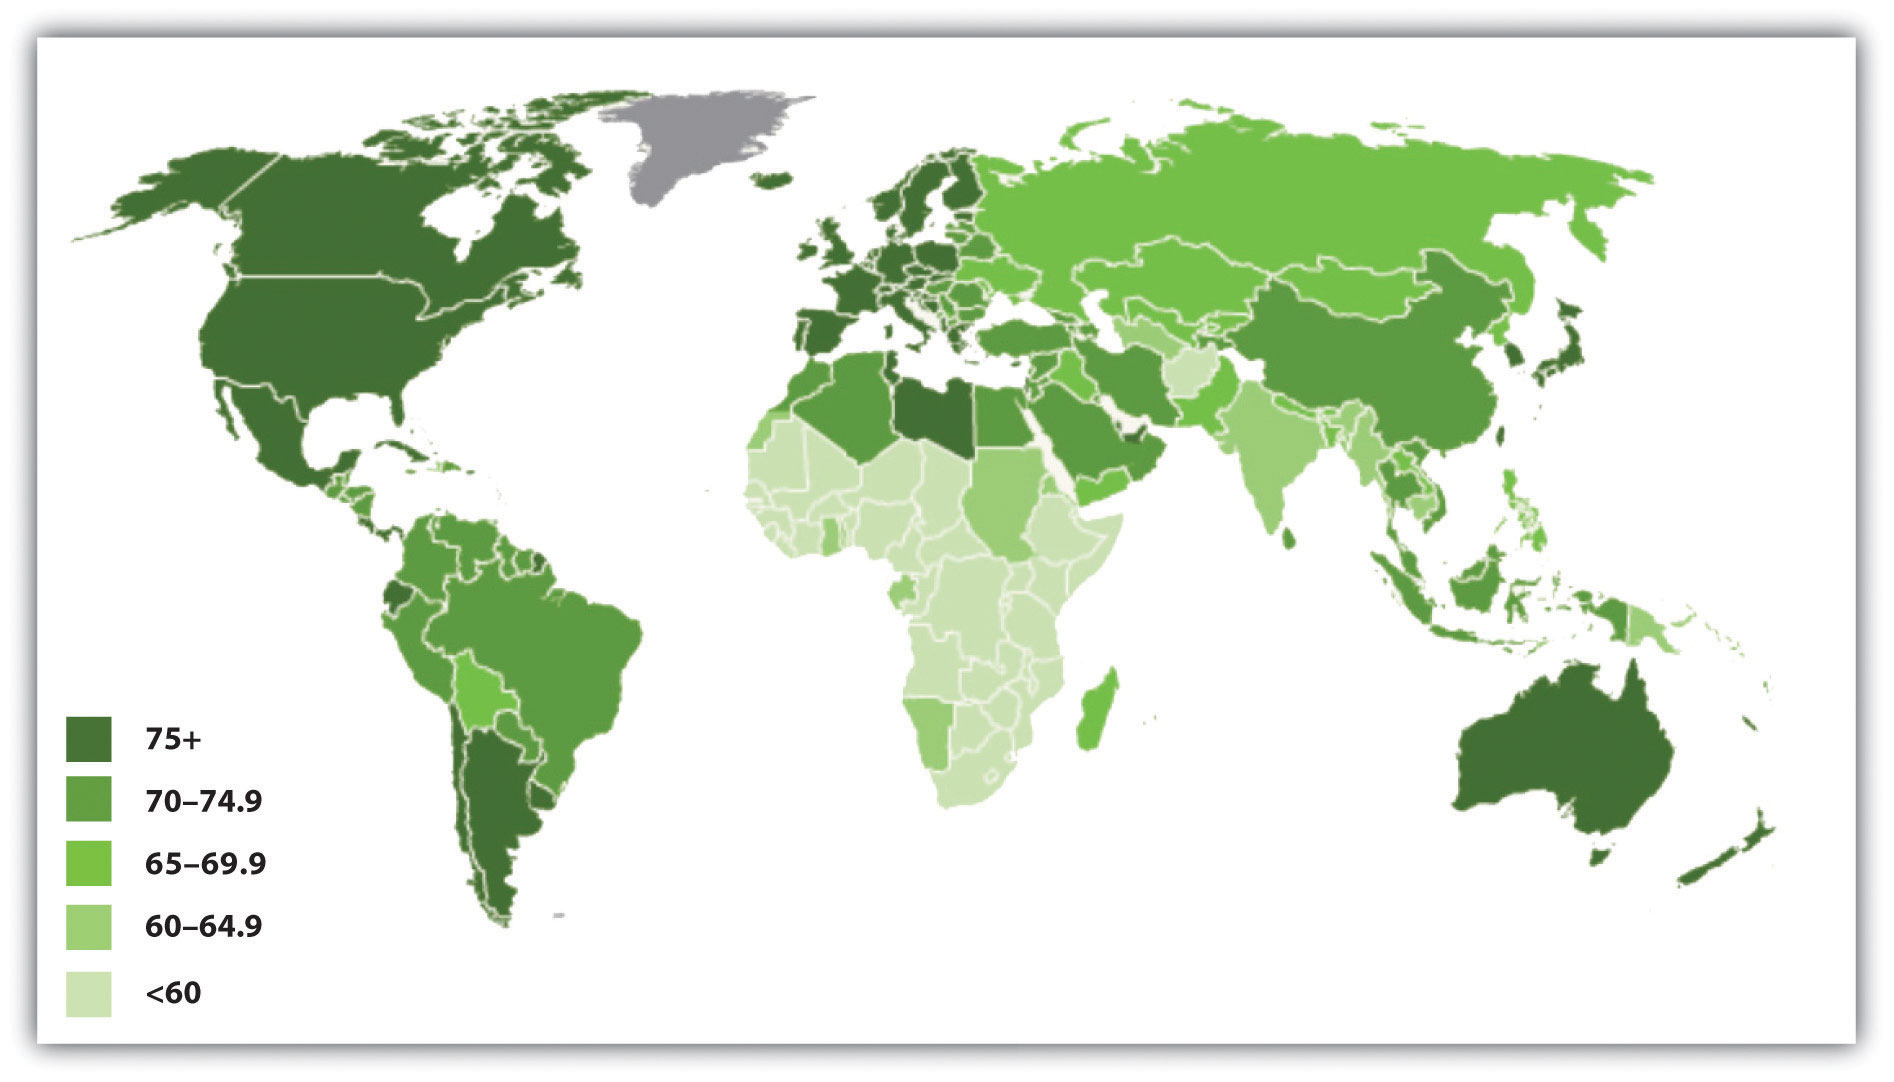
Source: Adapted from Population Reference Bureau. (2011). The world at 7 billion: World population data sheet: Life expectancy. Retrieved from http://www.prb.org/publications/datasheets/2011/world-population-data-sheet/world-map.aspx#/map/lifeexp.
What accounts for these large disparities? The major factor is the wealth or poverty of a nation, as the wealthiest nations have much longer life expectancies than the poorest ones. This is true because, as Chapter 2 “Poverty” noted, the poorest nations by definition have little money and few other resources. They suffer from hunger, AIDS, and other diseases, and they lack indoor plumbing and other modern conveniences found in almost every home in the wealthiest nations. As a result, they have high rates of infant and childhood mortality, and many people who make it past childhood die prematurely from disease, starvation, and other problems.
These differences mean that few people in these societies reach the age of 65 that Western nations commonly mark as the beginning of old age. Figure 6.2 “Percentage of Population Aged 65 or Older, 2011” depicts the percentage of each nation’s population that is 65 or older. Not surprisingly, the nations of Africa have very low numbers of people 65 or older. In Uganda, for example, only 3 percent of the population is at least 65, compared to 13 percent of Americans and 20–21 percent of Germans and Italians.
Figure 6.2 Percentage of Population Aged 65 or Older, 2011
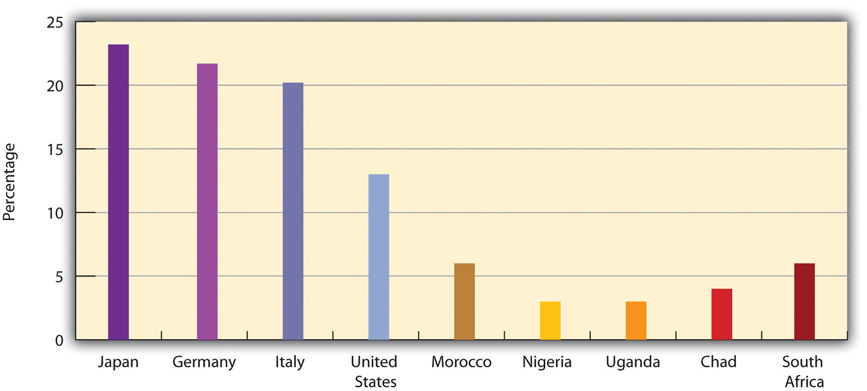
Source: Adapted from Population Reference Bureau. (2011). 2011 world population data sheet. Washington, DC: Author. Retrieved from http://www.prb.org/pdf11/2011population-data-sheet_eng.pdf.
Despite these international disparities, life expectancy overall has been increasing around the world. It was only 46 years worldwide in the early 1950s but was 69 in 2009 and is expected to reach about 75 by 2050 (Population Reference Bureau, 2011). This means that the number of people 65 or older is growing rapidly; they are expected to reach almost 1.5 billion worldwide by 2050, three times their number today and five times their number just twenty years ago (United Nations Population Division, 2011). Despite international differences in life expectancy and the elderly percentage of the population, the world as a whole is decidedly “graying,” with important implications for the cost and quality of elder care and other issues.
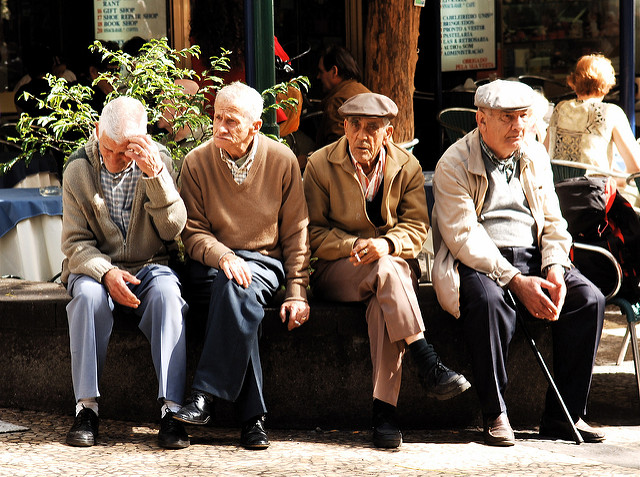
Older people now constitute 15 percent of the combined population of wealthy nations, but they will account for 26 percent by 2050.
Pedro Ribeiro Simões – Warming the bones – CC BY 2.0.
As life expectancy rises in poor nations, these nations will experience special problems (Hayutin, 2007). One problem will involve paying for the increased health care that older people in these nations will require. Because these nations are so poor, they will face even greater problems than the industrial world in paying for such care and for other programs and services their older citizens will need. Another problem stems from the fact that many poor nations are beginning or continuing to industrialize and urbanize. As they do so, traditional family patterns, including respect for the elderly and the continuation of their roles and influence, may weaken. One reason for this is that urban families have smaller dwelling units in which to accommodate their elderly relatives and lack any land onto which they can build new housing. Families in poor nations will thus find it increasingly difficult to accommodate their elders.
Life Expectancy in the United States
Life expectancy has been increasing in the United States along with the rest of the world (see Figure 6.3 “Changes in US Life Expectancy at Birth, 1900–2010”). It rose rapidly in the first half of the twentieth century and has increased steadily since then. From a low of 47.3 years in 1900, it rose to about 71 years in 1970 and 77 years in 2000 and to more than 78 years in 2010. Americans born in 2010 will thus be expected to live about 31 years longer than those born a century earlier.
Figure 6.3 Changes in US Life Expectancy at Birth, 1900–2010
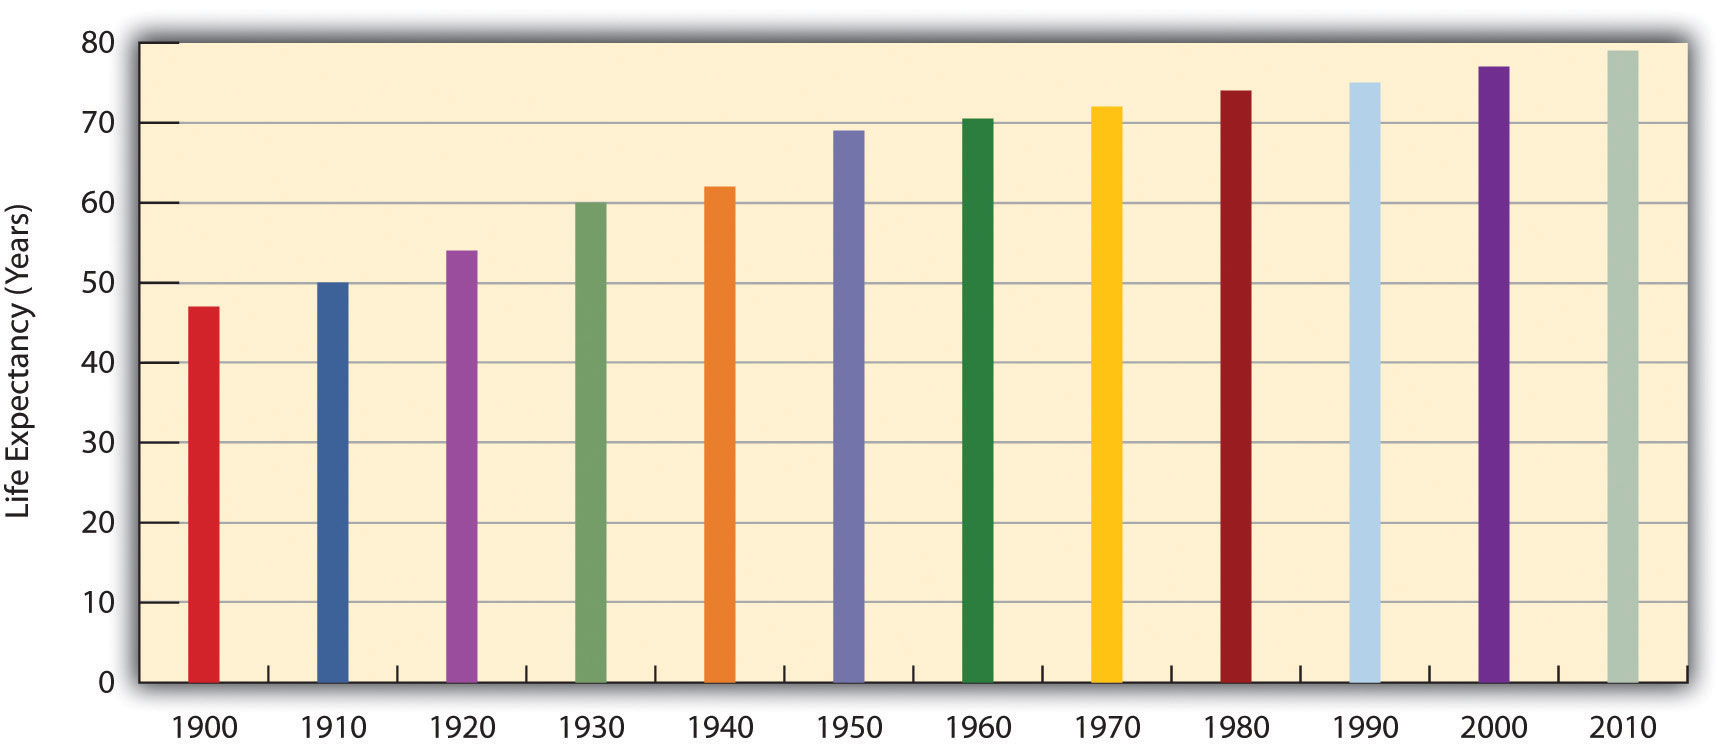
Sources: Data from Arias, E. (2010). United States life tables, 2006. National Vital Statistics Reports, 58(21), 1–40.
During the next few decades, the numbers of the elderly will increase rapidly thanks to the large baby boom generation born after World War II (from 1946 to 1964) that is now entering its mid-sixties. Figure 6.4 “Past and Projected Percentage of US Population Aged 65 or Older, 1900–2050” shows the rapid rise of older Americans (65 or older) as a percentage of the population that is expected to occur. Elders numbered about 3.1 million in 1900 (4.1 percent of the population), number about 40 million today, and are expected to reach 89 million by 2050 (20.2 percent of the population). The large increase in older Americans overall has been called the graying of America and will have important repercussions for elderly care and other aspects of old age in the United States, as we discuss later.
Figure 6.4 Past and Projected Percentage of US Population Aged 65 or Older, 1900–2050
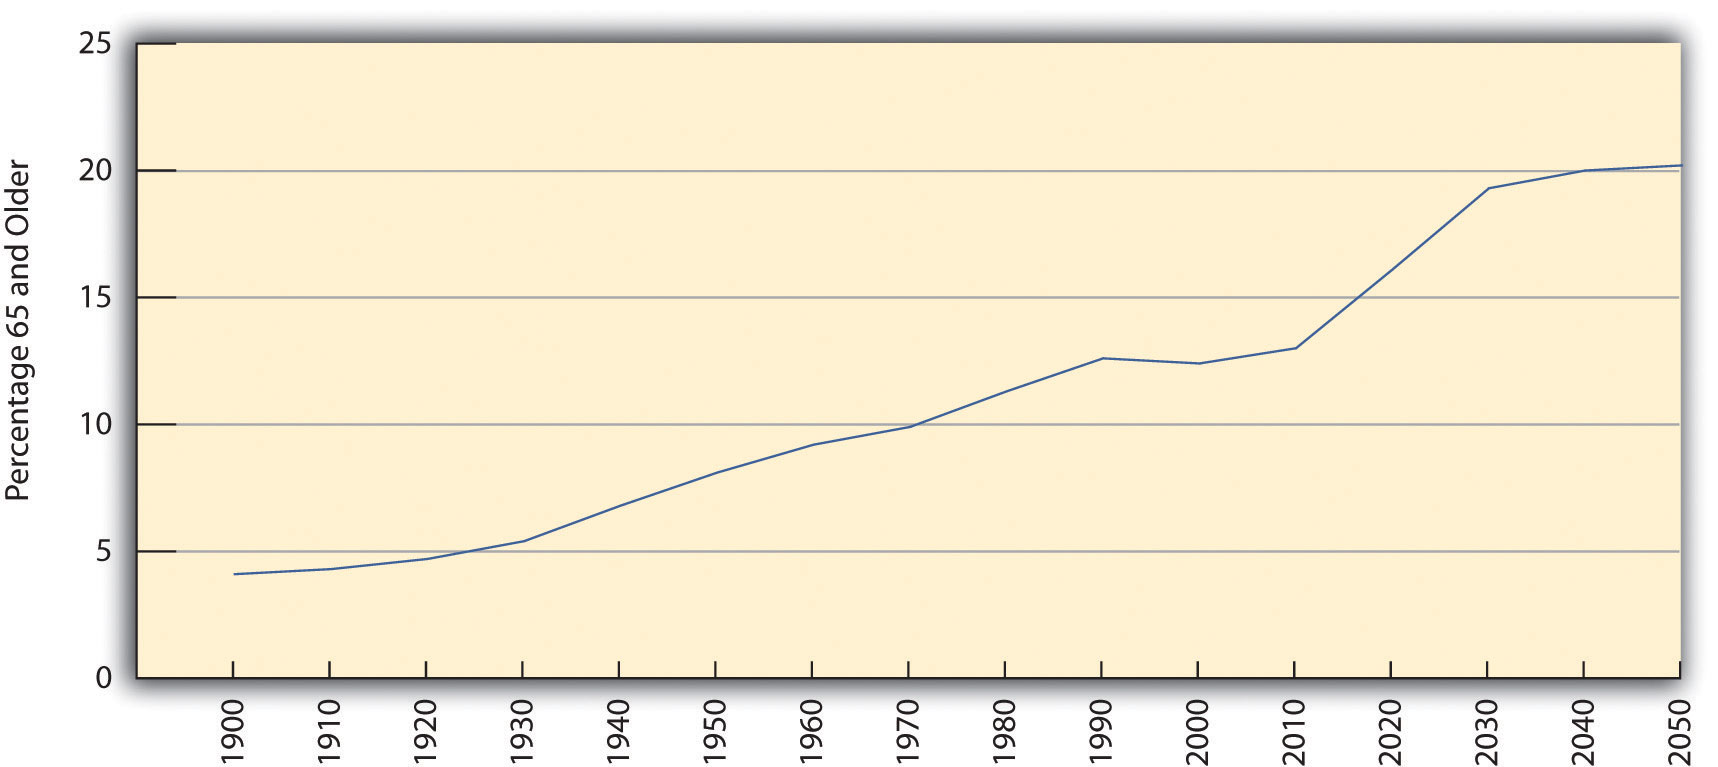
Source: Data from Administration on Aging. (n.d.). Projected future growth of the older population by age: 1900–2050. Retrieved from http://www.aoa.gov/AoARoot/Aging_Statistics/future_growth/future_growth.aspx.
Inequality in Life Expectancy
We have seen that inequality in life expectancy exists around the world, with life expectancy lower in poor nations than in wealthy nations. Inequality in life expectancy also exists within a given society along gender, race/ethnicity, and social class lines.
For gender, the inequality is in favor of women, who for both biological and social reasons outlive men across the globe. In the United States, for example, girls born in 2007 could expect to live 80.4 years on the average, but boys only 75.4 years.
In most countries, race and ethnicity combine with social class to produce longer life expectancies for the (wealthier) dominant race, which in the Western world is almost always white. The United States again reflects this international phenomenon: Whites born in 2007 could expect to live 78.4 years on the average, but African Americans only 73.6 years. In fact, gender and race combine in the United States to put African American males at a particular disadvantage, as they can expect to live only 70.0 years (see Figure 6.5 “Sex, Race, and Life Expectancy for US Residents Born in 2007”). The average African American male will die almost 11 years earlier than the average white woman.
Figure 6.5 Sex, Race, and Life Expectancy for US Residents Born in 2007
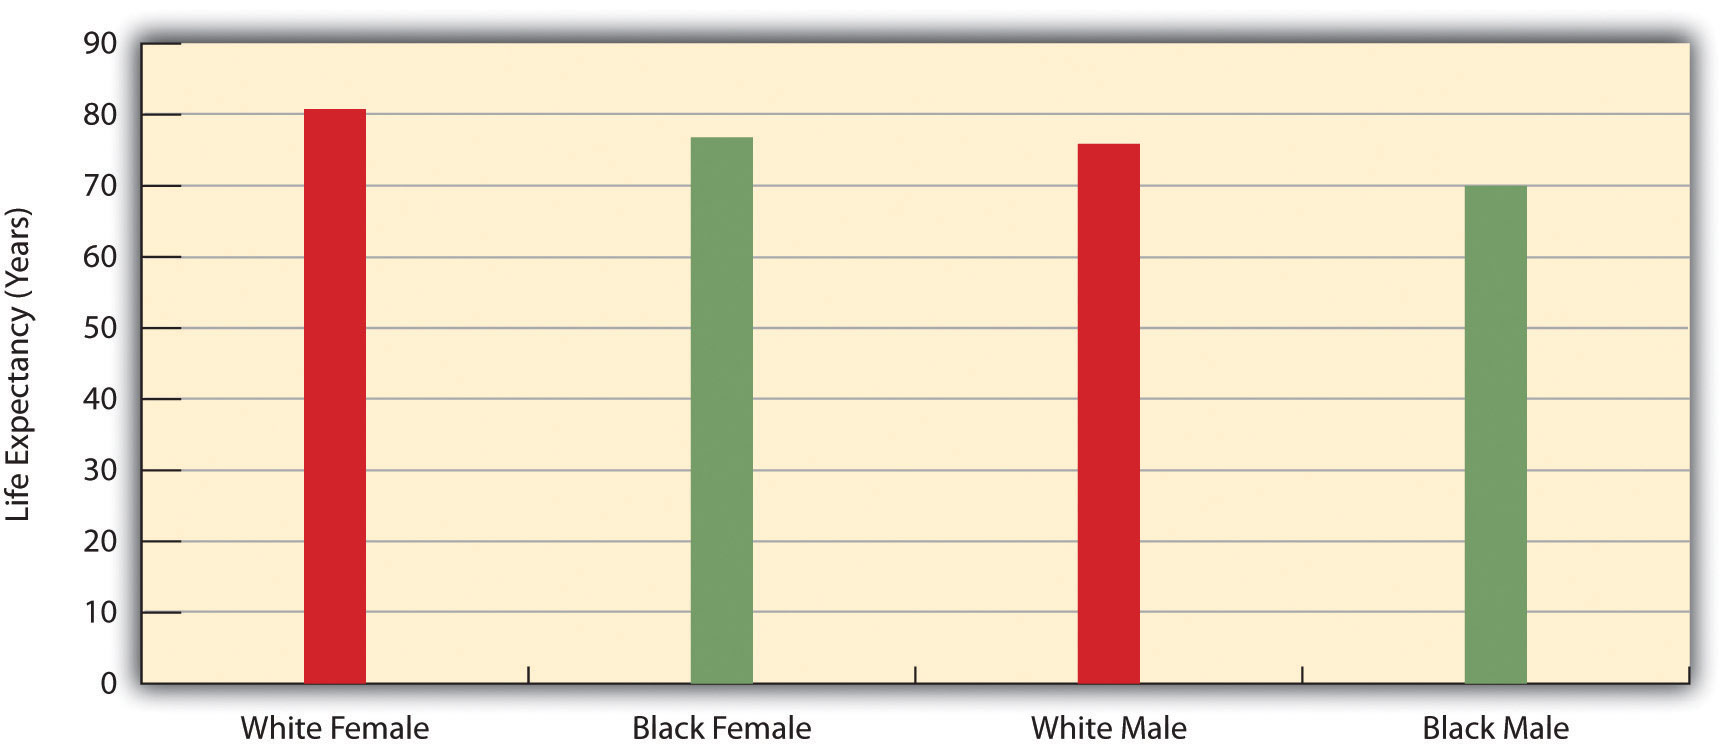
Source: Data from National Center for Health Statistics, US Department of Health and Human Services. (2010). Health, United States, 2010, with special feature on death and dying. Retrieved from http://www.cdc.gov/nchs/data/hus/hus10.pdf.
Key Takeaways
- Life expectancy differs widely around the world and is much higher in wealthy nations than in poor nations.
- Life expectancy has also been increasing around the world, including in the United States, and the increasing number of older people in the decades ahead will pose several serious challenges.
- Inequality in life expectancy exists within a given society along gender, race/ethnicity, and social class lines.
For Your Review
- As our nation and the world both “gray,” what do you think is the most important problem that will stem from the increasing number of older people?
- Write a short essay in which you discuss the problems that an elderly person you know, perhaps a grandparent, has experienced related to being older.
References
Hayutin, A. M. (2007). Graying of the global population. Public Policy & Aging Report, 17(4), 12–17.
Population Reference Bureau. (2011). 2011 world population data sheet. Washington, DC: Author.
United Nations Population Division. (2011). World population prospects: The 2010 revision. New York, NY: Author.
