2.5 Global Poverty
Learning Objectives
- Describe where poor nations tend to be located.
- Explain the difference between the modernization and dependency theories of poverty.
- List some of the consequences of global poverty.
As serious as poverty is in the United States, poverty in much of the rest of the world is beyond comprehension to the average American. Many of the world’s poor live in such desperate circumstances that they would envy the lives of poor Americans. Without at all meaning to minimize the plight of the American poor, this section provides a brief look at the world’s poor and at the dimensions of global poverty
Global Inequality
The world has a few very rich nations and many very poor nations, and there is an enormous gulf between these two extremes. If the world were one nation, its median annual income (at which half of the world’s population is below this income and half is above it) would be only $1,700 (Dikhanov, 2005). The richest fifth of the world’s population would have three-fourths of the world’s entire income, while the poorest fifth of the world’s population would have only 1.5 percent of the world’s income, and the poorest two-fifths would have only 5.0 percent of the world’s income (Dikhanov, 2005). Reflecting this latter fact, these poorest two-fifths, or about 2 billion people, live on less than $2 per day (United Nations Development Programme, 2009). As Figure 2.5 “Global Income Distribution (Percentage of World Income Held by Each Fifth of World Population)” illustrates, this distribution of income resembles a champagne glass.
Figure 2.5 Global Income Distribution (Percentage of World Income Held by Each Fifth of World Population)
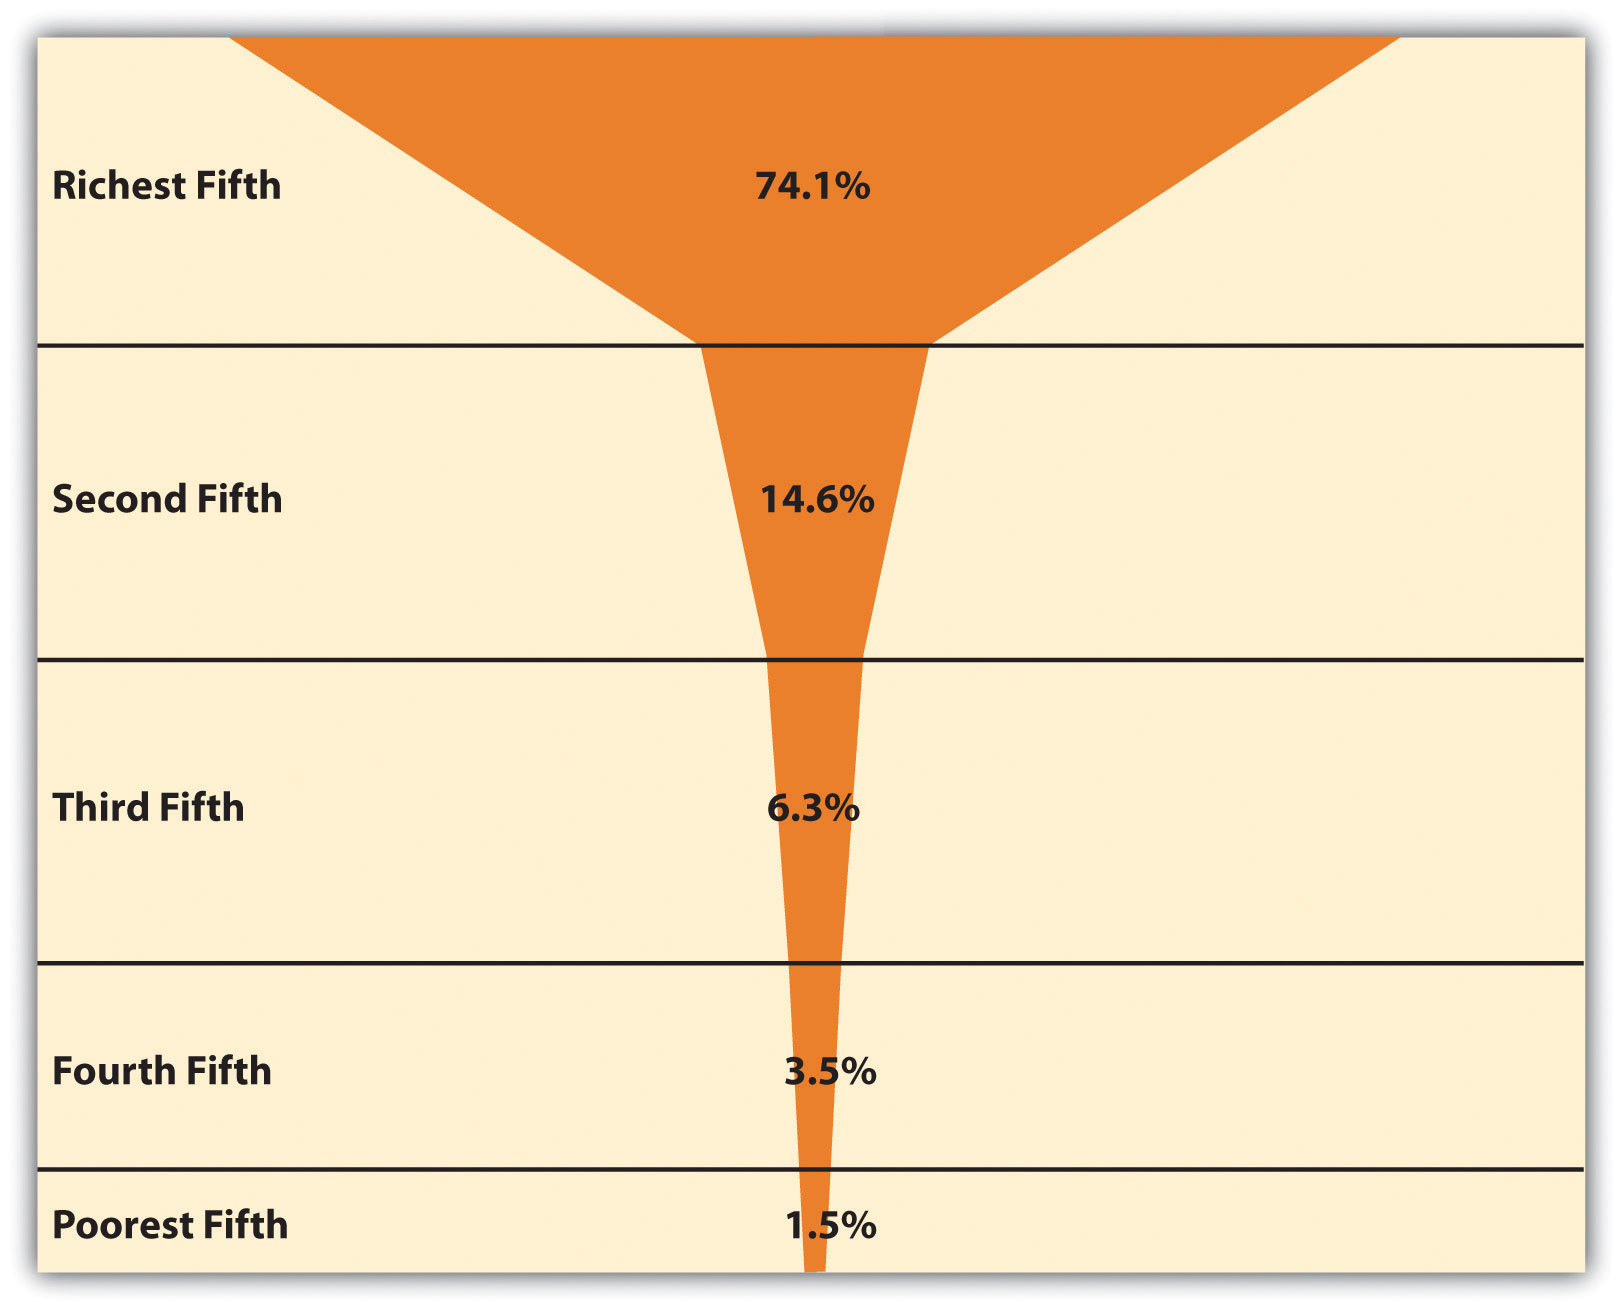
Source: Data from Dikhanov, Y. (2005). Trends in global income distribution, 1970–2000, and scenarios for 2015. New York, NY: United Nations Development Programme.
To understand global inequality, it is helpful to classify nations into a small number of categories based on their degree of wealth or poverty, their level of industrialization and economic development, and related factors. Over the decades, scholars and international organizations such as the United Nations and the World Bank have used various classification systems, or typologies. A popular typology today simply ranks nations into groups called wealthy (or high-income) nations, middle-income nations, and poor (or low-income) nations, based on measures such as gross domestic product (GDP) per capita (the total value of a nation’s goods and services divided by its population). This typology has the advantage of emphasizing the most important variable in global stratification: how much wealth a nation has. At the risk of being somewhat simplistic, the other important differences among the world’s nations all stem from their degree of wealth or poverty. Figure 2.6 “Global Stratification Map” depicts these three categories of nations (with the middle category divided into upper-middle and lower-middle). As should be clear, whether a nation is wealthy, middle income, or poor is heavily related to the continent on which it is found.
Figure 2.6 Global Stratification Map
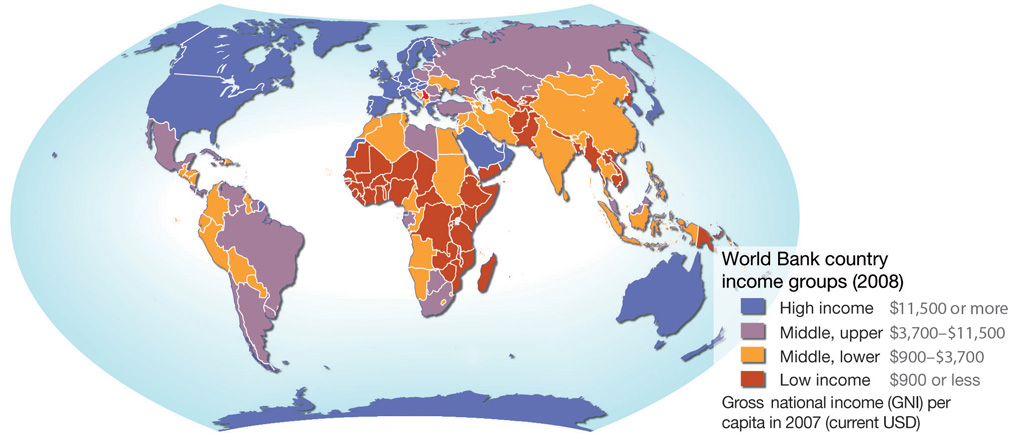
Source: Adapted from UNEP/GRID-Arendal Maps and Graphics Library. (2009).Country income groups (World Bank classification). Retrieved from http://maps.grida.no/go/graphic/country-income-groups-world-bank-classification.
Measuring Global Poverty

The World Bank has begun to emphasize vulnerability to poverty. Many people who are not officially poor have a good chance of becoming poor within a year. Strategies to prevent this from happening are a major focus of the World Bank.
Wikimedia Commons – CC BY-SA 2.0.
How do we know which nations are poor? A very common measure of global poverty was developed by the World Bank, an international institution funded by wealthy nations that provides loans, grants, and other aid to help poor and middle-income nations. Each year the World Bank publishes its World Development Report, which provides statistics and other information on the economic and social well-being of the globe’s almost two hundred nations. The World Bank puts the official global poverty line (which is considered a measure of extreme poverty) at income under $1.25 per person per day, which amounts to about $456 yearly per person or $1,825 for a family of four. According to this measure, 1.4 billion people, making up more than one-fifth of the world’s population and more than one-fourth of the population of developing (poor and middle-income) nations, are poor. This level of poverty rises to 40 percent of South Asia and 51 percent of sub-Saharan Africa (Haughton & Khandker, 2009).
In a new development, the World Bank has begun emphasizing the concept of vulnerability to poverty, which refers to a significant probability that people who are not officially poor will become poor within the next year. Determining vulnerability to poverty is important because it enables antipoverty strategies to be aimed at those most at risk for sliding into poverty, with the hope of preventing them from doing so.
Vulnerability to poverty appears widespread; in several developing nations, about one-fourth of the population is always poor, while almost one-third is vulnerable to poverty or is slipping into and out of poverty. In these nations, more than half the population is always or sometimes poor. (Haughton & Khandker, 2009) summarize this situation: “As typically defined, vulnerability to poverty is more widespread than poverty itself. A wide swathe of society risks poverty at some point of time; put another way, in most societies, only a relatively modest portion of society may be considered as economically secure.”
Explaining Global Poverty
Explanations of global poverty parallel those of US poverty in their focus on individualistic versus structural problems. One type of explanation takes an individualistic approach by, in effect, blaming the people in the poorest nations for their own poverty, while a second explanation takes a structural approach in blaming the plight of poor nations on their treatment by the richest ones. Table 2.4 “Theory Snapshot” summarizes the two sets of explanations.
Table 2.4 Theory Snapshot
| Theory | Major assumptions |
|---|---|
| Modernization theory | Wealthy nations became wealthy because early on they were able to develop the necessary beliefs, values, and practices for trade, industrialization, and rapid economic growth to occur. Poor nations remained poor because they failed to develop these beliefs, values, and practices; instead, they continued to follow traditional beliefs and practices that stymied industrial development and modernization. |
| Dependency theory | The poverty of poor nations stems from their colonization by European nations, which exploited the poor nations’ resources and either enslaved their populations or used them as cheap labor. The colonized nations were thus unable to develop a professional and business class that would have enabled them to enter the industrial age and to otherwise develop their economies. |
Modernization Theory
The individualistic explanation is called modernization theory (Rostow, 1990). According to this theory, rich nations became wealthy because early on they were able to develop the “correct” beliefs, values, and practices—in short, the correct culture—for trade, industrialization, and rapid economic growth to occur. These cultural traits include a willingness to work hard, to abandon tradition in favor of new ways of thinking and doing things, and to adopt a future orientation rather than one focused on maintaining present conditions. Thus Western European nations began to emerge several centuries ago as economic powers because their populations adopted the kinds of values and practices just listed. In contrast, nations in other parts of the world never became wealthy and remain poor today because they never developed the appropriate values and practices. Instead, they continued to follow traditional beliefs and practices that stymied industrial development and modernization.
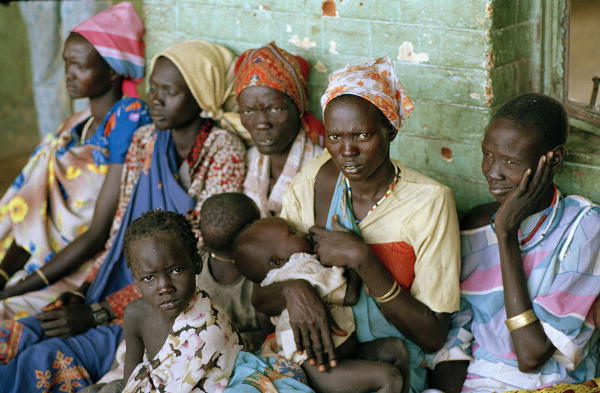
According to modernization theory, poor nations are poor because their people never developed values such as an emphasis on hard work.
United Nations Photo – OLS Brings Support to Strained Medical Services – CC BY-NC-ND 2.0.
Modernization theory has much in common with the culture of poverty theory discussed earlier. It attributes the poverty of poor nations to their failure to develop the “proper” beliefs, values, and practices necessary for economic success both at the beginning of industrialization during the nineteenth century and in the two centuries that have since transpired. Because modernization theory implies that people in poor nations do not have the talent and ability to improve their lot, it may be considered a functionalist explanation of global inequality.
Dependency Theory
The structural explanation for global stratification is called dependency theory, which may be considered a conflict explanation of global inequality. Not surprisingly, this theory’s views sharply challenge modernization theory’s assumptions (Packenham, 1992). Whereas modernization theory attributes global stratification to the “wrong” cultural values and practices in poor nations, dependency theory blames global stratification on the exploitation of these nations by wealthy nations. According to this view, poor nations never got the chance to pursue economic growth because early on they were conquered and colonized by European ones. The European nations stole the poor nations’ resources and either enslaved their populations or used them as cheap labor. They installed their own governments and often prevented the local populace from getting a good education. As a result, the colonized nations were unable to develop a professional and business class that would have enabled them to enter the industrial age and to otherwise develop their economies. Along the way, wealthy nations sold their own goods to colonized nations and forced them to run up enormous debt that continues to amount today.
In today’s world, huge multinational corporations continue to exploit the labor and resources of the poorest nations, say dependency theorists. These corporations run sweatshops in many nations, in which workers toil in inhumane conditions at extremely low wages (Sluiter, 2009). Often the corporations work hand-in-hand with corrupt officials in the poor nations to strengthen their economic stake in the countries.
Comparing the Theories
Which makes more sense, modernization theory or dependency theory? As with many theories, both make sense to some degree, but both have their faults. Modernization theory places too much blame on poor nations for their own poverty and ignores the long history of exploitation of poor nations by rich nations and multinational corporations alike. For its part, dependency theory cannot explain why some of the poorest countries are poor even though they were never European colonies; neither can it explain why some former colonies such as Hong Kong have been able to attain enough economic growth to leave the rank of the poorest nations. Together, both theories help us understand the reasons for global stratification, but most sociologists would probably favor dependency theory because of its emphasis on structural factors in the world’s historic and current economy.
The Lives of the World’s Poor
Poor nations are the least industrialized and most agricultural of all the world’s countries. They consist primarily of nations in Africa and parts of Asia and constitute roughly half of the world’s population. Many of these nations rely heavily on one or two crops, and if weather conditions render a crop unproductive in a particular season, the nations’ hungry become even hungrier. By the same token, if economic conditions reduce the price of a crop or other natural resource, the income from exports of these commodities plummets, and these already poor nations become even poorer.

People in poor nations live in the most miserable conditions possible.
United Nations Photo – Maslakh Camp for Displaced, Afghanistan – CC BY-NC-ND 2.0.
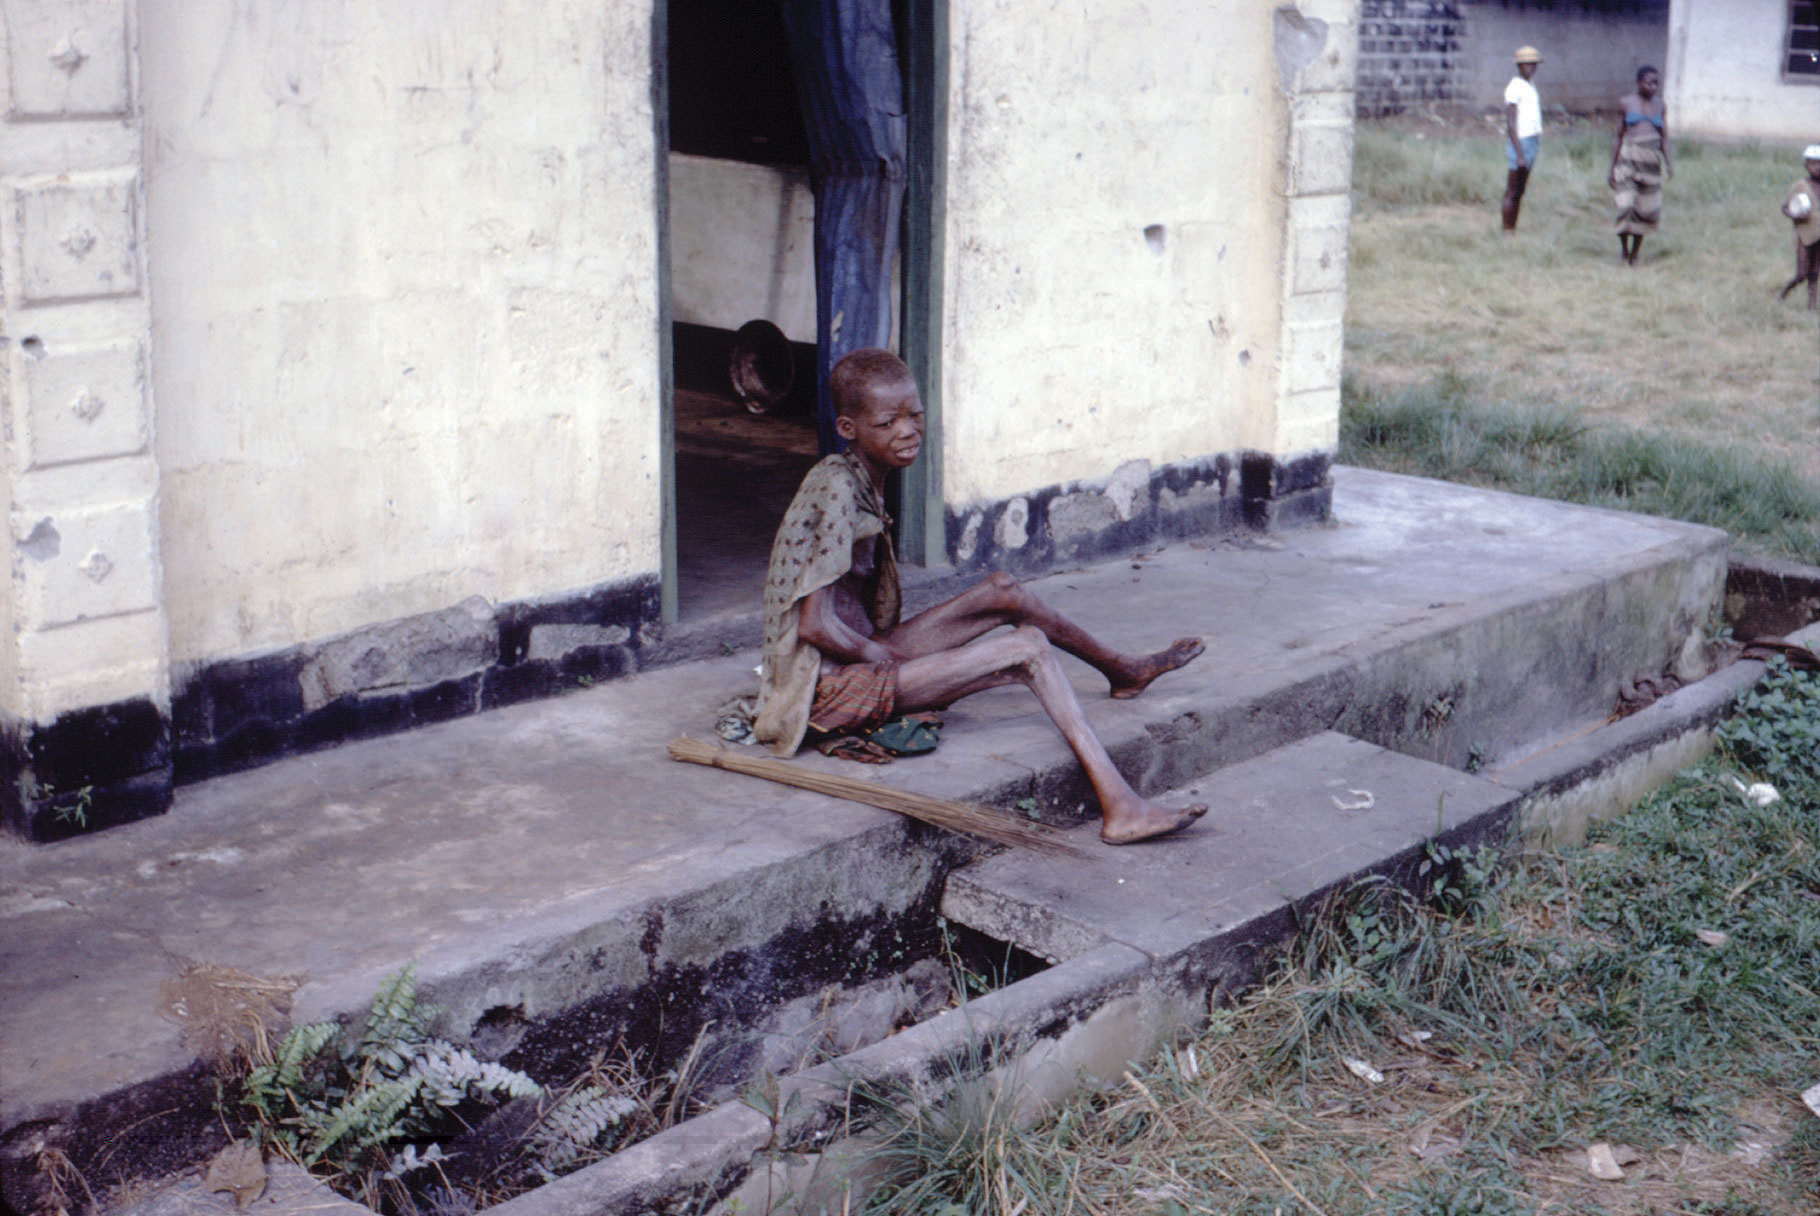
By any standard, the more than 1.4 billion people in poor nations live a desperate existence in the most miserable conditions possible. They suffer from AIDS and other deadly diseases, live on the edge of starvation, and lack indoor plumbing, electricity, and other modern conveniences that most Americans take for granted. Most of us have seen unforgettable photos or video footage of African children with stick-thin limbs and distended stomachs reflecting severe malnutrition.
It would be nice if these images were merely fiction, but unfortunately they are far too real. AIDS, malaria, starvation, and other deadly diseases are common. Many children die before reaching adolescence, and many adults die before reaching what in the richest nations would be considered middle age. Many people in the poorest nations are illiterate, and a college education remains as foreign to them as their way of life would be to us. The images of the world’s poor that we see in television news reports or in film documentaries fade quickly from our minds. Meanwhile, millions of people on our planet die every year because they do not have enough to eat, because they lack access to clean water or adequate sanitation, or because they lack access to medicine that is found in every CVS, Rite Aid, and Walgreens in the United States. We now examine some specific dimensions and consequences of global poverty.
Life Expectancy
When we look around the world, we see that global poverty is literally a matter of life and death. The clearest evidence of this fact comes from data on life expectancy, or the average number of years that a nation’s citizens can be expected to live. Life expectancy certainly differs within each nation, with some people dying younger and others dying older, but poverty and related conditions affect a nation’s overall life expectancy to a startling degree.
Figure 2.7 Average Life Expectancy across the Globe (Years)
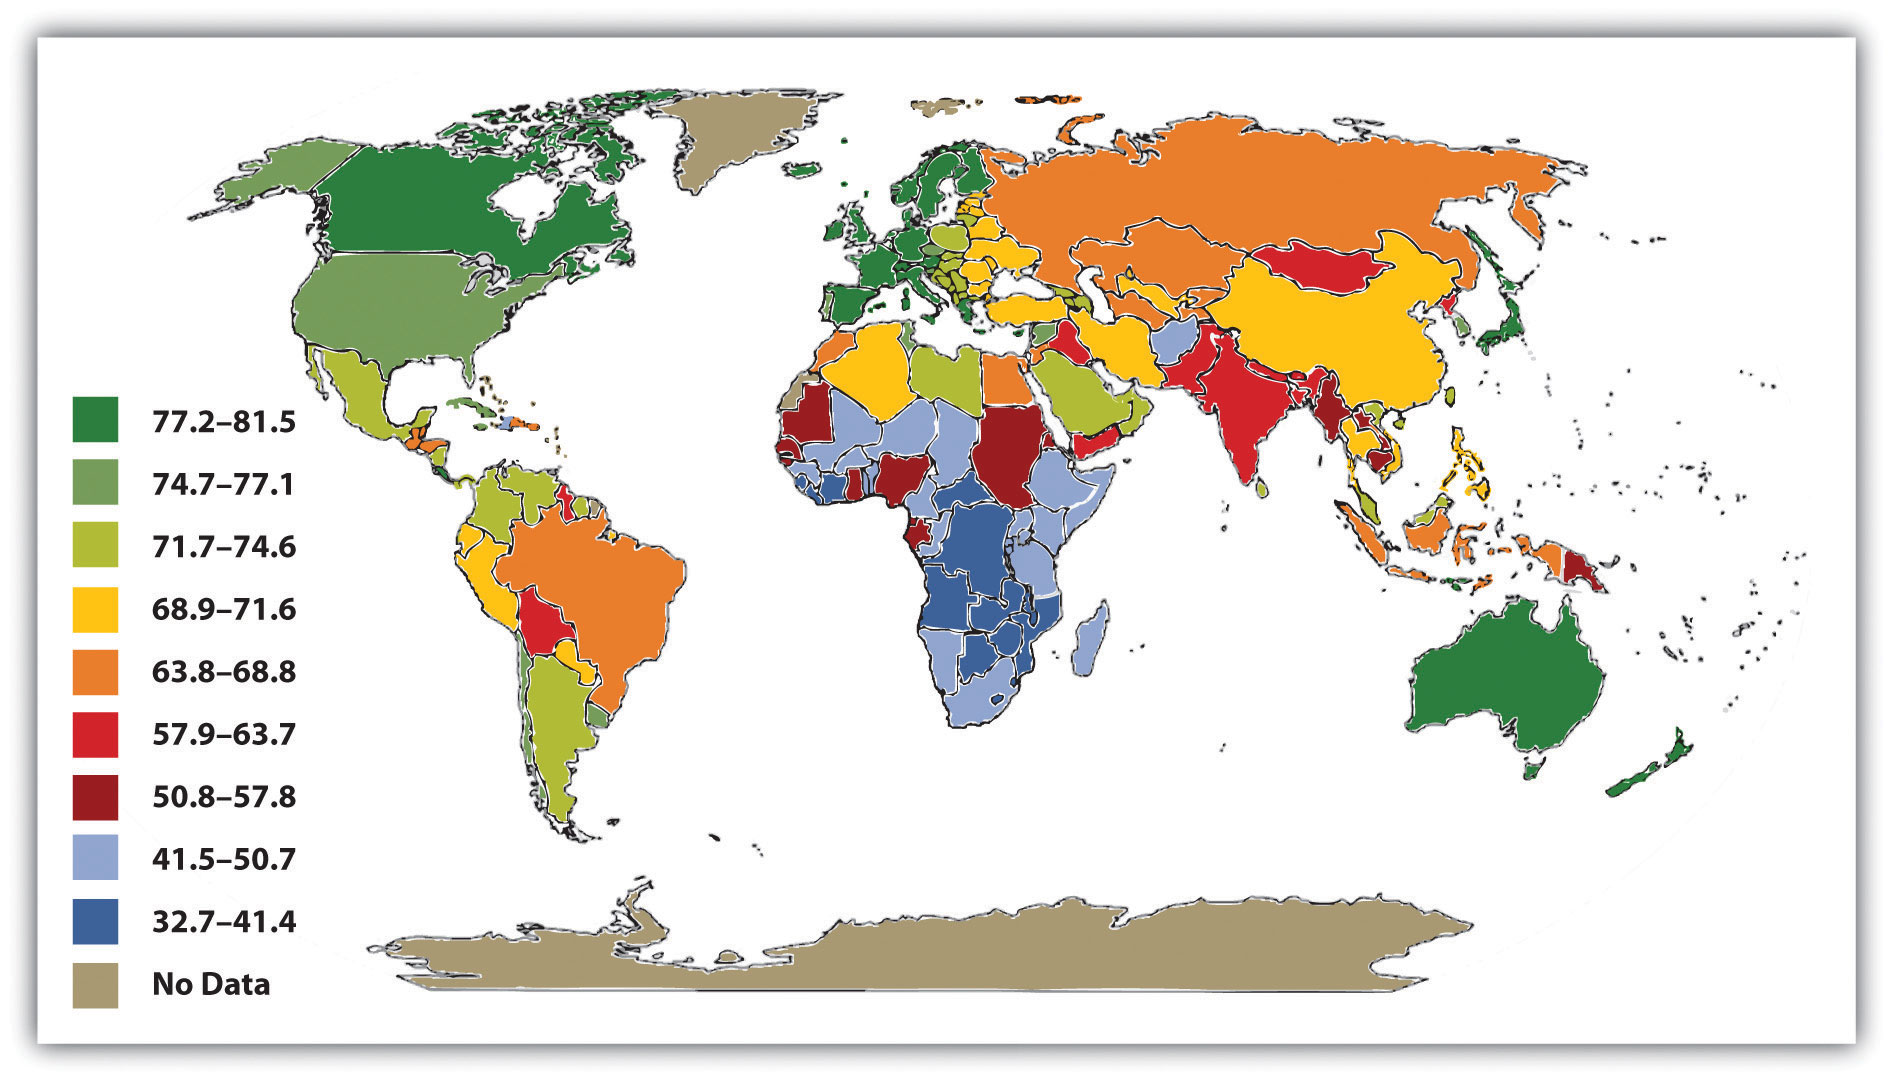
Source: Adapted from Global Education Project. (2004). Human conditions: World life expectancy map. Retrieved from http://www.theglobaleducationproject.org/earth/human-conditions.php.
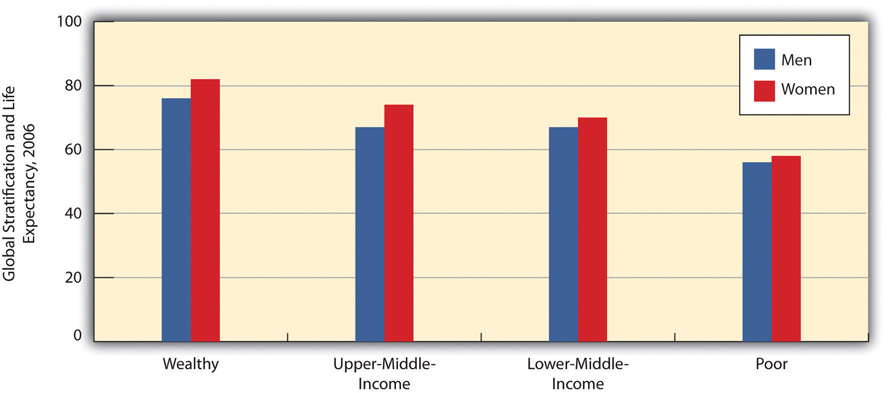
A map of global life expectancy appears in Figure 2.7 “Average Life Expectancy across the Globe (Years)”. Life expectancy is highest in North America, Western Europe, and certain other regions of the world and lowest in Africa and South Asia, where life expectancy in many nations is some 30 years shorter than in other regions. Another way of visualizing the relationship between global poverty and life expectancy appears in Figure 2.8 “Global Poverty and Life Expectancy, 2006”, which depicts average life expectancy for wealthy nations, upper-middle-income nations, lower-middle-income nations, and poor nations. Men in wealthy nations can expect to live 76 years on average, compared to only 56 in poor nations; women in wealthy nations can expect to live 82 years, compared to only 58 in poor nations. Life expectancy in poor nations is thus 20 and 24 years lower, respectively, for the two sexes.
Figure 2.8 Global Poverty and Life Expectancy, 2006
Source: Data from World Bank. (2009). World development report 2009. Washington, DC: Author.
Child Mortality
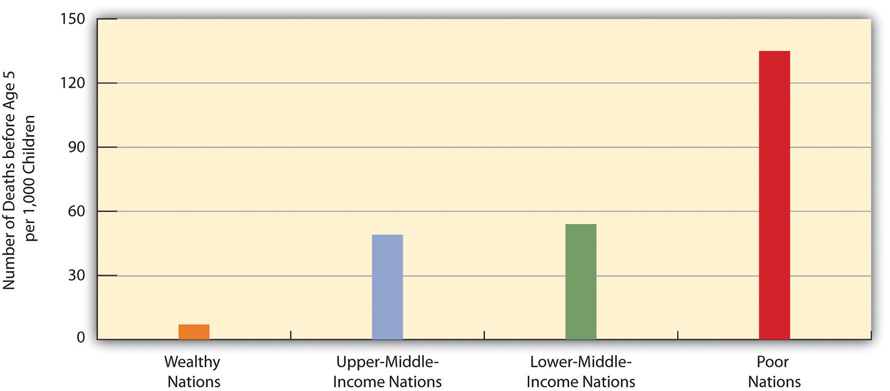
A key contributor to life expectancy and also a significant consequence of global poverty in its own right is child mortality, the number of children who die before age 5 per 1,000 children. As Figure 2.9 “Global Poverty and Child Mortality, 2006” shows, the rate of child mortality in poor nations is 135 per 1,000 children, meaning that 13.5 percent of all children in these nations die before age 5. In a few African nations, child mortality exceeds 200 per 1,000. In contrast, the rate in wealthy nations is only 7 per 1,000. Children in poor nations are thus about 19 times (13.5 ÷ 0.7) more likely to die before age 5 than children in wealthy nations.
Figure 2.9 Global Poverty and Child Mortality, 2006
Source: Data from World Bank. (2009). World development report 2009. Washington, DC: Author.
Sanitation and Clean Water
Two other important indicators of a nation’s health are access to adequate sanitation (disposal of human waste) and access to clean water. When people lack adequate sanitation and clean water, they are at much greater risk for life-threatening diarrhea, serious infectious diseases such as cholera and typhoid, and parasitic diseases such as schistosomiasis (World Health Organization, 2010). About 2.4 billion people around the world, almost all of them in poor and middle-income nations, do not have adequate sanitation, and more than 2 million, most of them children, die annually from diarrhea. More than 40 million people worldwide, almost all of them again in poor and middle-income nations, suffer from a parasitic infection caused by flatworms.
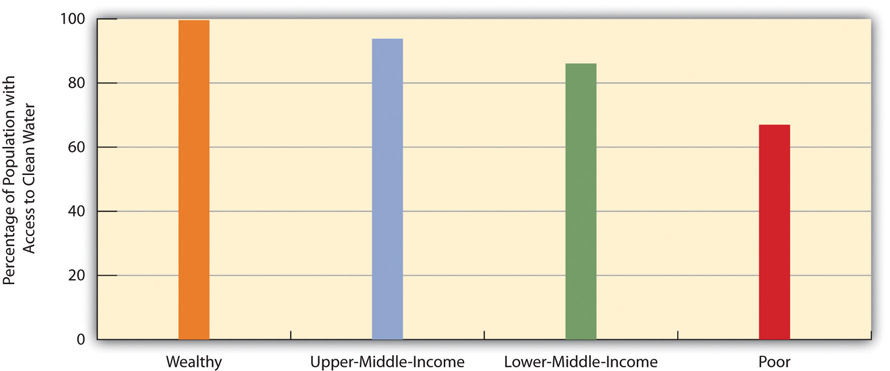
As Figure 2.10 “Global Stratification and Access to Adequate Sanitation, 2006” and Figure 2.11 “Global Stratification and Access to Clean Water, 2006” show, access to adequate sanitation and clean water is strongly related to national wealth. Poor nations are much less likely than wealthier nations to have adequate access to both sanitation and clean water. Adequate sanitation is virtually universal in wealthy nations but is available to only 38 percent of people in poor nations. Clean water is also nearly universal in wealthy nations but is available to only 67 percent of people in poor nations.
Figure 2.10 Global Stratification and Access to Adequate Sanitation, 2006

Source: Data from World Bank. (2010). Health nutrition and population statistics. Retrieved from http://databank.worldbank.org/ddp/home.do.
Figure 2.11 Global Stratification and Access to Clean Water, 2006
Source: Data from World Bank. (2010). Health nutrition and population statistics. Retrieved from http://databank.worldbank.org/ddp/home.do.
Malnutrition
About one-fifth of the population of poor nations, about 800 million individuals, are malnourished.
Dr. Lyle Conrad at the Centers for Disease Control and Prevention- ID# 6874 – public domain.
Another health indicator is malnutrition. This problem is caused by a lack of good food combined with infections and diseases such as diarrhea that sap the body of essential nutrients. About one-fifth of the population of poor nations, or about 800 million individuals, are malnourished; looking just at children, in developing nations more than one-fourth of children under age 5, or about 150 million altogether, are underweight. Half of all these children live in only three nations: Bangladesh, India, and Pakistan; almost half the children in these and other South Asian nations are underweight. Children who are malnourished are at much greater risk for fat and muscle loss, brain damage, blindness, and death; perhaps you have seen video footage of children in Africa or South Asia who are so starved that they look like skeletons. Not surprisingly, child malnutrition contributes heavily to the extremely high rates of child mortality that we just examined and is estimated to be responsible for more than 5 million deaths of children annually (United Nations Children’s Fund [UNICEF], 2006; World Health Organization, 2010).
Adult Literacy
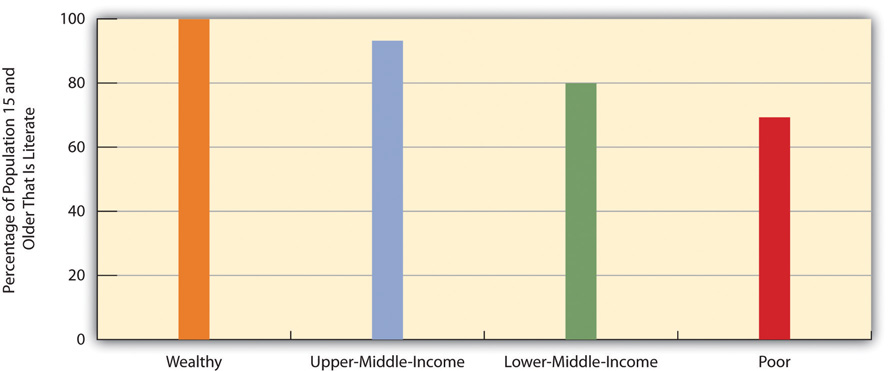
Moving from the area of health, a final indicator of human development is adult literacy, the percentage of people 15 and older who can read and write a simple sentence. Once again we see that people in poor and middle-income nations are far worse off (see Figure 2.12 “Global Poverty and Adult Literacy, 2008”). In poor nations, only about 69 percent of adults 15 and older can read and write a simple sentence. The high rate of illiteracy in poor nations not only reflects their poverty but also contributes to it, as people who cannot read and write are obviously at a huge disadvantage in the labor market.
Figure 2.12 Global Poverty and Adult Literacy, 2008
Source: Data from World Bank. (2010). Health nutrition and population statistics. Retrieved from http://databank.worldbank.org/ddp/home.do.
Applying Social Research
Unintended Consequences of Welfare Reform
Aid to Families with Dependent Children (AFDC) was a major government program to help the poor from the 1930s to the 1960s. Under this program, states allocated federal money to provide cash payments to poor families with children. Although the program was heavily criticized for allegedly providing an incentive to poor mothers both to have more children and to not join the workforce, research studies found little or no basis for this criticism. Still, many politicians and much of the public accepted the criticism as true, and AFDC became so unpopular that it was replaced in 1997 by a new program, Temporary Assistance for Needy Families (TANF), which is still a major program today.
TANF is more restrictive in many respects than AFDC was. In particular, it limits the amount of time a poor family can receive federal funds to five years, and allows states to impose a shorter duration for funding, which many have done. In addition, it requires single parents in families receiving TANF funds to work at least thirty hours a week (or twenty hours a week if they have a child under the age of 6) and two parents to work at least thirty-five hours per week combined. In most states, going to school to obtain a degree does not count as the equivalent of working and thus does not make a parent eligible for TANF payments. Only short-term programs or workshops to develop job skills qualify.
Did welfare reform involving TANF work? Many adults formerly on AFDC found jobs, TANF payments nationwide have been much lower than AFDC payments, and many fewer families receive TANF payments than used to receive AFDC payments. All these facts lead many observers to hail TANF as a successful program. However, sociologists and other scholars who study TANF families say the numbers are misleading because poor families have in effect been excluded from TANF funding because of its strict requirements. The reduced payments and lower number of funded families indicate the failure of TANF, they say, not its success.
Several problems explain why TANF has had these unintended consequences. First, many families are poor for many more than five years, and the five-year time limit under TANF means that they receive financial help for only some of the years they live in poverty. Second, because the federal and state governments provide relatively little financial aid for child care, many parents simply cannot afford to work, and if they don’t work, they lose their TANF payments. Third, jobs are certainly difficult to find, especially if, as is typical, a poor parent has relatively little education and few job skills, and if parents cannot find a job, they again lose their TANF payments. Fourth, many parents cannot work because they have physical or mental health problems or because they are taking care of a family member or friend with a health problem; these parents, too, become ineligible for TANF payments.
Sociologist Lorna Rivera put a human face to these problems in a study of fifty poor women in Boston, Massachusetts. She lived among them, interviewed them individually, and conducted focus groups. She found that TANF worsened the situation of these women for the reasons just stated, and concluded that welfare reform left these and other poor women “uneducated, underemployed, underpaid, and unable to effectively move themselves and their families forward.”
Ironically, some studies suggest that welfare reform impaired the health of black women for several reasons. Many ended up with jobs with long bus commutes and odd hours, leading to sleep deprivation and less time for medical visits. Many of these new workers also suddenly had to struggle to find affordable day care for their children. These problems are thought to have increased their stress levels and, in turn, harmed their health.
The research by social scientists on the effects of TANF reveals that the United States took a large step backward when it passed welfare reform in the 1990s. Far from reducing poverty, welfare reform only worsened it. This research underscores the need for the United States to develop better strategies for reducing poverty similar to those used by other Western democracies, as discussed in the Note 2.19 “Lessons from Other Societies” box in this chapter.
Sources: (Blitstein, 2009; Mink, 2008; Parrott & Sherman, 2008; Rivera, 2008)
Key Takeaways
- People in poor nations live in the worst conditions possible. Deadly diseases are common, and many children die before reaching adolescence.
- According to the modernization theory, rich nations became rich because their peoples possessed certain values, beliefs, and practices that helped them become wealthy. Conversely, poor nations remained poor because their peoples did not possess these values, beliefs, and practices.
- According to the dependency theory, poor nations have remained poor because they have been exploited by rich nations and by multinational corporations.
For Your Review
- Considering all the ways in which poor nations fare much worse than wealthy nations, which one seems to you to be the most important problem that poor nations experience? Explain your answer.
- Which theory of global poverty, modernization or dependency, makes more sense to you? Why?
References
Blitstein, R. (2009). Weathering the storm. Miller-McCune, 2(July–August), 48–57.
Dikhanov, Y. (2005). Trends in global income distribution, 1970–2000, and scenarios for 2015. New York, NY: United Nations Development Programme.
Haughton, J., & Khandker, S. R. (2009). Handbook on poverty and inequality. Washington, DC: World Bank.
Mink, G. (2008). TANF reauthorization and opportunity to invest in America’s future. Paper presented to the ADA Economic Policy Committee. Retrieved July 25, 2011, from http://www.adaction.org/pages/issues/all-policy-resolutions/social-amp-domestic/issues-brief-no.-13-welfare-reform.php.
Packenham, R. A. (1992). The dependency movement: Scholarship and politics in development studies. Cambridge, MA: Harvard University Press.
Parrott, S., & Sherman, A. (2008). TANF at 10: Program results are more mixed than often understood. Washington, DC: Center on Budget and Policy Priorities.
Rivera, L. (2008). Laboring to learn: Women’s literacy and poverty in the post-welfare era. Urbana, IL: University of Illinois Press.
Rostow, W. W. (1990). The stages of economic growth: A non-communist manifesto (3rd ed.). New York, NY: Cambridge University Press.
Sluiter, L. (2009). Clean clothes: A global movement to end sweatshops. New York, NY: Pluto Press.
United Nations Children’s Fund. (2006). Progress for children: A report card on nutrition. New York, NY: Author.
United Nations Development Programme. (2009). Human development report 2009. New York, NY: Author.
World Health Organization. (2010). Children’s environmental health. Retrieved from http://www.who.int/ceh/risks/cehwater2/en/index.html.
World Health Organization. (2010). Water sanitation and health. Retrieved from http://www.who.int/water_sanitation_health/diseases/malnutrition/en/.
