12.3 Problems in Work and the Economy
Learning Objectives
- Outline recent trends in jobs and wages.
- Discuss the effects of unemployment.
- Summarize the problems associated with increasing economic inequality.
The economy and the quality and quantity of work certainly affect the lives of all Americans. At the same time, work and the economy give rise to many kinds of problems that also affect millions of Americans. This section examines several of these problems.
The Loss of Jobs and Wages
Because the American economy greatly weakened as the nation went into a deep recession in late 2007, it should come as no surprise that millions of jobs have been lost during the past half-decade and that wages have declined for many Americans. Yet long before the recession began, certain ominous trends in the American economy were evident. These trends involved a general loss of jobs in many sectors of the American economy and stagnating wages.
These trends partly reflected the fact that the United States has joined other industrial nations in moving into a postindustrial economy. In a postindustrial economy, information technology and service jobs replace the machines and manufacturing jobs that are hallmarks of an industrial economy. If physical prowess and skill with one’s hands were prerequisites for many industrial jobs, mental prowess and communication skills are prerequisites for postindustrial jobs.
This move to a postindustrial economy has been a mixed blessing for many Americans. The information age has obvious benefits too numerous to mention, but there has also been a cost to the many workers whom postindustrialization and the globalization of the economy have left behind. Since the 1980s, many manufacturing companies moved their plants from US cities to sites in the developing world in Asia and elsewhere, a problem called capital flight. Along with the faltering economy, these trends have helped fuel a loss of 5.5 million manufacturing jobs from the American economy since 2000 (Hall, 2011).
A related problem is outsourcing, in which US companies hire workers overseas for customer care, billing services, and other jobs that Americans used to do. China, India, and the Philippines, which have skilled workforces relatively fluent in English, are the primary nations to which US companies outsource their work. According to projections, some 3.4 million jobs will have been lost by 2015 because of outsourcing (Levine, 2012). Many call centers employ workers in India, and when you call up a computer company or some other business for technical help, you might very well talk with an Indian. Because these call centers have cost Americans jobs and also because Americans and Indians often have trouble understanding each other’s accents, outsourcing has been very controversial since it became popular in the early 2000s.
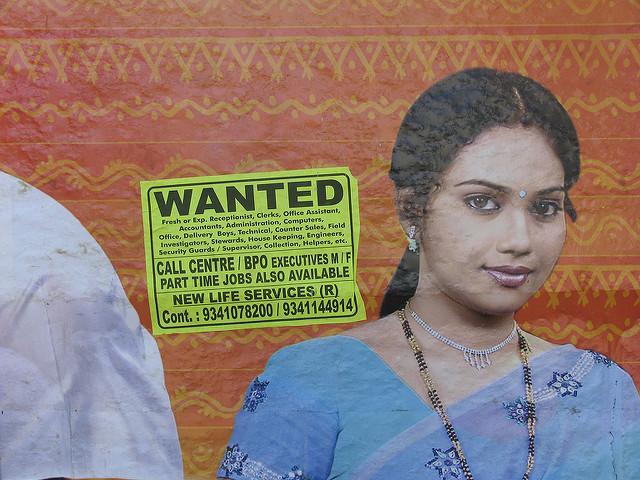
Many American jobs have been lost because of outsourcing to other countries.
Paul Keller – wanted – CC BY 2.0.
All these problems reflect a more general shift in the United States from goods-producing jobs to service jobs. Although some of these service jobs, such as many in the financial and computer industries, are high paying, many are in low-wage occupations, such as restaurant and clerical work, that pay less than the goods-producing jobs they replaced. Partly as a result, the average hourly wage (in 2009 dollars) in the United States for workers (excluding managers and supervisors) rose by only one dollar from $17.46 in 1979 to $18.63 in 2009. This change represented an increase of just 0.2 percent per year during that three-decade span, as workers’ wages have essentially stagnated during the last three decades (Economic Policy Institute, 2012).
Wage changes in recent years also depend on what social class someone is in. While the average compensation of chief executive officers (CEOs) of large corporations grew by 167 percent from 1989 to 2007, the average compensation of the typical worker grew by only 10 percent (Mishel, Bernstein, & Shierholz, 2009). Another way of understanding this disparity is perhaps more striking. In 1965, the average compensation of CEOs was twenty-four times greater than that of the typical worker; in 2009, their compensation was 185 times greater than that of the typical worker (Economic Policy Institute, 2012). These figures reflect growing economic inequality in the United States, a problem we further examine later in this chapter.
The Decline of Labor Unions
One of the most important developments accompanying industrialization in the nineteenth century was the rise of labor unions and their conflict with management over wages and working conditions (Dubofsky & Dulles, 2010). The pay that workers received was quite low, and the conditions in which they worked were often miserable. The typical employee worked at least ten hours a day for six or seven days a week, with almost no overtime pay and no paid vacations or holidays. To improve wages and working conditions, many labor unions were founded after the Civil War, only to meet determined opposition from companies, the government, and the courts. Companies told each other which workers were suspected of being union members, and these workers were then prevented from getting jobs. Strikers were often arrested for violating laws prohibiting strikes. When juries began finding them not guilty, employers turned to asking judges for injunctions that prohibited strikes. Workers who then went on strike were held in contempt of court by the judge as juries were kept out of the process.
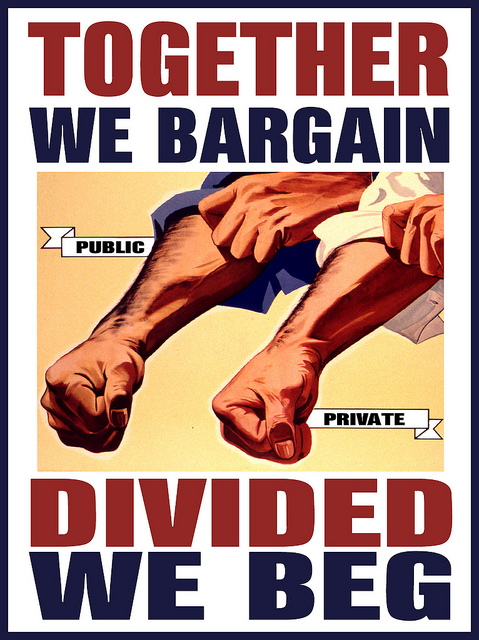
From the 1870s through the 1930s, labor unions fought companies over issues such as low wages and substandard working conditions.
DonkeyHotey – Together We Bargain – CC BY 2.0.
Labor strife also marked the Great Depression, when masses of people blamed business leaders for their economic plight. Huge sit-ins and other labor protests occurred at auto plants in Detroit. In response, the Congress passed several laws that gave workers a minimum wage, the right to join unions, a maximum-hour workweek, and other rights that Americans now take for granted.
Today labor unions have lost some of their influence, especially as postindustrialization has supplanted the industrial economy and as the United States has lost much of its manufacturing base. Four decades ago, about one-fourth of all private-sector nonagricultural workers belonged to labor unions. By 1985 this figure had dropped to 14.6 percent, and today it stands at only 7.2 percent (Hirsch & Macpherson, 2011). In response, labor unions have intensified their efforts to increase their membership, only to find that US labor laws are filled with loopholes that allow companies to prevent their workers from forming a union. For example, after a company’s workers vote to join a union, companies can appeal the vote, and it can take several years for courts to order the company to recognize the union. In the meantime, the low wages, substandard working conditions, and other factors that motivated workers to want to join a union are allowed to continue.
Just as the growth of unions during the late nineteenth and early twentieth centuries helped to raise workers’ wages, the decline of unions has lowered wages. Two reasons explain this decline (Mishel et al., 2009). First, union workers earn about 14 percent more than nonunion workers (controlling for experience, education, occupation, and other factors), a phenomenon known as the union wage premium. Because fewer workers are now in unions than four decades ago, they are less likely to benefit from this premium. Second, as unions have declined, there has been less pressure on nonunion employers to raise their wages to match union wages.
Because the union wage premium is greater for African Americans and Latinos than for whites, the wage decline caused by the decline of unions has probably been steeper for those two groups than for whites. It is also true that union workers are more likely than nonunion workers to be covered by employer-paid health insurance and also to have lower health premiums and deductibles. The decline of unions has thus meant that the average worker today is less likely to have employer-paid health insurance and, if they do, more likely to have higher premiums and deductibles.
Unemployment
Unemployment is a fact of life. There will always be people laid off or fired, who voluntarily quit their jobs, or who just graduated school and are still looking for work. But most unemployed people are involuntarily unemployed, and for them the financial and psychological consequences can be devastating, as we saw in the news story that began this chapter.
Unemployment rates rise and fall with the economy, and the national unemployment rate was as high as 10.2 percent in October 2009 amid the Great Recession that began almost two years earlier. It was still 8.3 percent in February 2012, amounting to almost 13 million people. But whether unemployment is high or low, it always varies by race and ethnicity, with African American and Latino unemployment rates much higher than the white rate (see Figure 12.3 “Race, Ethnicity, and Unemployment Rate, February 2012”). Unemployment is also higher for younger people than for older people. In February 2012, 23.8 percent of all teenagers in the labor force (aged 16–19) were unemployed, a figure three times higher than that for adults. The unemployment rate for African Americans in this age group was a very high 34.7 percent, twice as high as the 21.3 percent figure for whites in this age group (Bureau of Labor Statistics, 2012).
Figure 12.3 Race, Ethnicity, and Unemployment Rate, February 2012
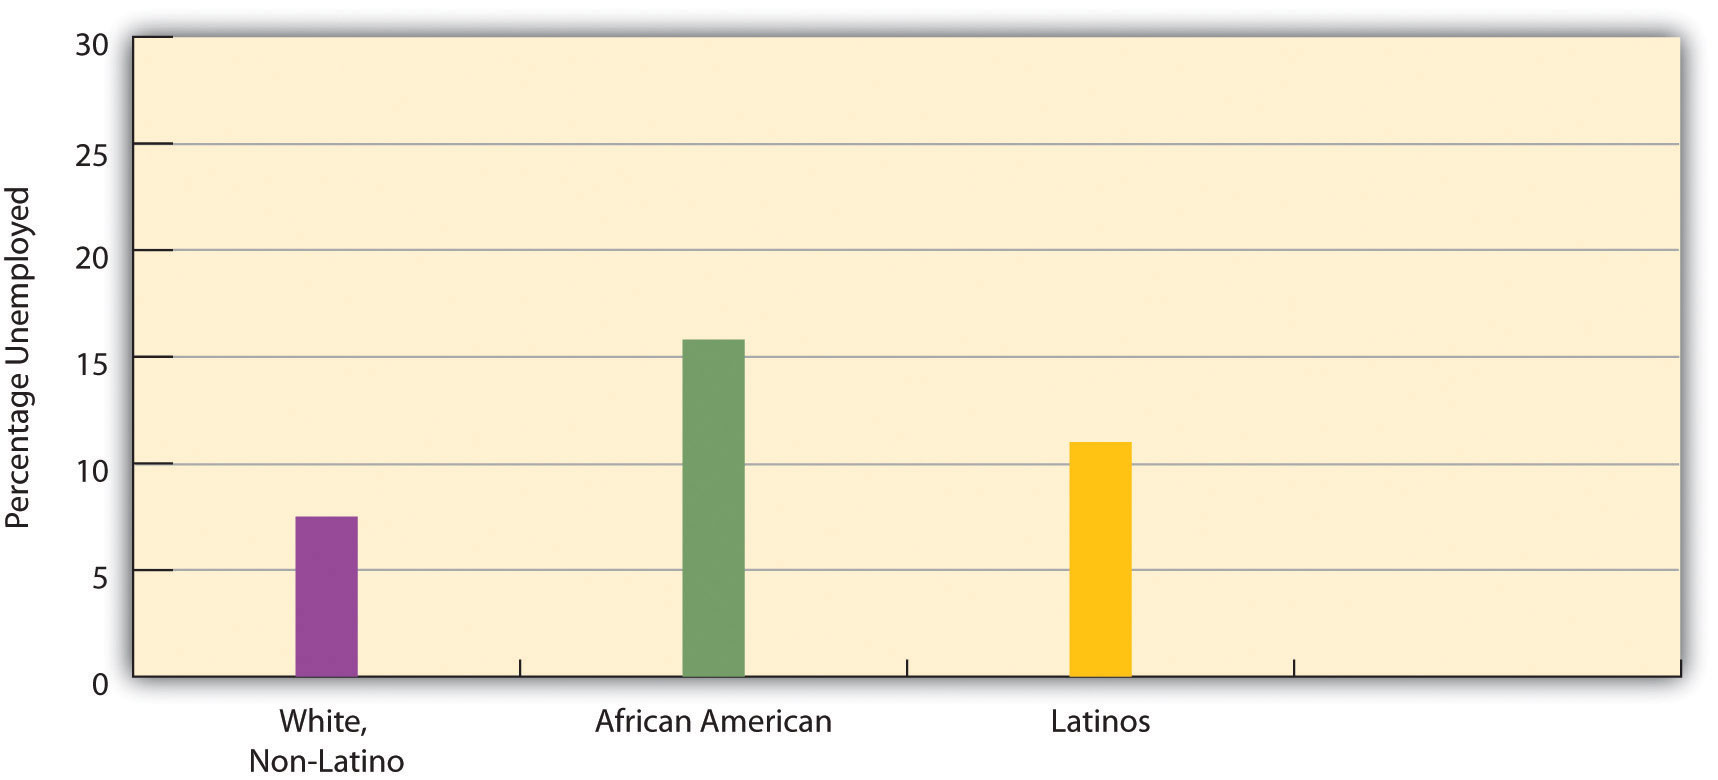
Source: Bureau of Labor Statistics (2012). Employment & earnings online. Retrieved from http://www.bls.gov/opub/ee/home.htm.
Unemployment figures are misleading in an important respect, as they do not include people who are underemployed. Underemployment includes the unemployed and also two other types of people: (a) those who are working part-time but who want to work full-time—the so-called marginally attached, and (b) those who have stopped looking for work because they have not been able to find a job. Many economists think that underemployment provides a more accurate measure than unemployment of the number of people with employment problems.
For example, in December 2011, when the unemployment rate was 8.5 percent and 13 million people were officially unemployed, the underemployment rate was 15.2 percent, equal to 23.8 million people (Shierholz, 2012). These figures are almost twice as high as the official unemployment figures. Reflecting the racial/ethnic disparity in unemployment, 24.4 percent of African American workers and 22.3 percent of Latino workers were underemployed, compared to only 12.5 percent of white workers. Reflecting on the great amount of underemployment during the Great Recession, one economist commented, “When you combine the long-term unemployed with those who are dropping out and those who are working part time because they can’t find anything else, it is just far beyond anything we’ve seen in the job market since the 1930s” (Herbert, 2010, p. A25).
We have just seen that unemployment rises when the economy falters and that race and ethnicity affect the probability of being unemployed. These two facts provide evidence supporting the sociological imagination (see Chapter 1 “Understanding Social Problems”). As C. Wright Mills (1959) emphasized in his original discussion of this concept, unemployment is best viewed more as a public issue than as a personal trouble. When so many people are unemployed during an economic recession and when there is such striking evidence of higher unemployment rates among the persons of color who have the least opportunity for the education and training needed to obtain and keep a job, it is evident that high unemployment rates reflect a public issue rather than just a collection of public troubles.
Several kinds of problems make it difficult for people of color to be hired into jobs and thus contribute to the racial/ethnic disparity in unemployment. The Para 12.142 box discusses these problems.
Applying Social Research
Race, Ethnicity, and Employment
As the text discusses, people of color are more likely than whites to be unemployed or underemployed. While a relative lack of education helps explain these higher rates for people of color, other kinds of problems are also apparent.
One problem is racial discrimination on the part of employers, regardless of how conscious employers are of their discriminatory behavior. Chapter 4 “Gender Inequality” recounted a study by sociologist Devah Pager (2003), who had young white and African American men apply independently in person for various jobs in Milwaukee. These men wore the same type of clothing and reported similar levels of education and other qualifications. Some said they had a criminal record, while others said they had not committed any crimes. In striking evidence of racial discrimination in hiring, African American applicants without a criminal record were hired at the same low rate as white applicants with a criminal record.
Pager and sociologists Bruce Western and Bart Bonikowski also investigated racial discrimination in another field experiment in New York City (Pager, Bonikowski, & Western, 2009). They had white, African American, and Latino “testers,” all of them “well-spoken, clean-cut young men” (p. 781), apply in person to low-level service jobs (e.g., retail sales and delivery drivers) requiring no more than a high school education; all the testers had similar (hypothetical) qualifications. Almost one-third (31 percent) of white testers received a call back or job offer, compared to only 25.2 percent of Latino testers and 15.2 percent of African American testers. The researchers concluded that their findings “add to a large research program demonstrating the continuing contribution of discrimination to racial inequality in the post-civil rights era” (p. 794).
Other kinds of evidence also reveal racial discrimination in hiring. Two scholars sent job applications in response to help-wanted ads in Boston and Chicago (Bertrand & Mullainathan, 2003). They randomly assigned the applications to feature either a “white-sounding” name (e.g., Emily or Greg) or an “African American–sounding” name (e.g., Jamal and Lakisha). White names received 50 percent more callbacks than African American names for job interviews.
Racial differences in access to the informal networks that are often so important in finding a job also contribute to the racial/ethnic disparity in employment. In a study using data from a nationwide survey of a random sample of Americans, sociologist Steve McDonald and colleagues found that people of color and women are less likely than white males to receive informal word of vacant, high-level supervisory positions (McDonald, Nan, & Ao, 2009).
As these studies indicate, research by sociologists and other social scientists reveals that race and ethnicity continue to make a difference in employment prospects for Americans. This body of research reveals clear evidence of discrimination, conscious or unconscious, in hiring and also of racial/ethnic differences in access to the informal networks that are often so important for hiring. By uncovering this evidence, these studies underscore the need to address discrimination, access to informal networks, and other factors that contribute to racial and ethnic disparities in employment.
The Impact of Unemployment
Although the news article that began this chapter gave us a moving account of unemployed people at food banks, survey data also provide harsh evidence of the social and psychological effects of being unemployed. In July 2010, the Pew Research Center issued a report based on a survey of 810 adults who were currently unemployed or had been unemployed since the Great Recession began in December 2007 and 1,093 people who had never been unemployed during the recession (Morin & Kochhar, 2010). The report’s title, Lost Income, Lost Friends—and Loss of Self-Respect, summarized its major findings.
Of those who had been unemployed for at least six months (long-term unemployment), 44 percent said that the recession had caused “major changes” in their lives, versus only 20 percent of those who had never been unemployed. More than half of the long-term unemployed said their family income had declined, and more than 40 percent said that their family relations had been strained and that they had lost contact with close friends. In another finding, 38 percent said they had “lost some self-respect” from being unemployed. One-third said they were finding it difficult to pay their rent or mortgage, compared to only 16 percent of those who had never been unemployed during the recession. Half had borrowed money from family or friends to pay bills, versus only 18 percent of the never unemployed. Of all the people who had been unemployed, almost half had experienced sleep difficulties, and 5 percent had experienced drug or alcohol problems. All these numbers paint a distressing picture of the social and psychological impact of unemployment during the Great Recession that began in late 2007.
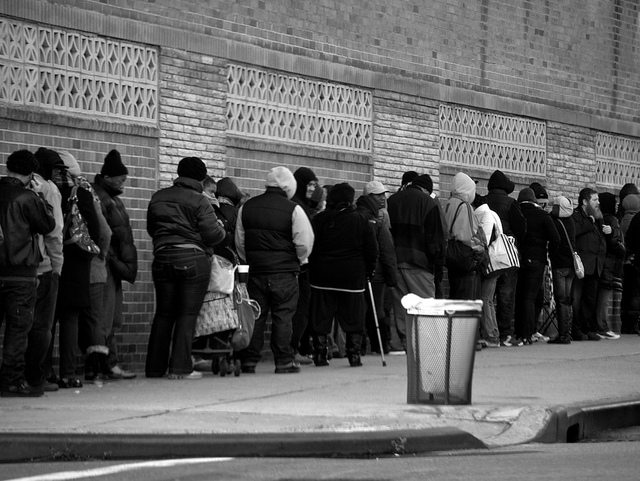
Unemployment lines were all too common in recent years. Long-term unemployment often causes various social and psychological difficulties.
Rawle C. Jackman – The line of hope… – CC BY-NC-ND 2.0.
Unemployment also has a significant impact on children whose parent or parents are unemployed. The Note 12.21 “Children and Our Future” box discusses this impact.
Children and Our Future
The Hidden Casualties of Unemployment
As unemployment soared in the wake of the Great Recession that began in 2007, many more children lived in a household where a parent had become unemployed. By early 2010, 11 percent of American children, or 8.1 million children overall, had an unemployed parent. Just slightly more than two years earlier, this number had been much smaller, 4.8 million. In just over two years, then, the number of children with an unemployed parent grew by two-thirds.
After their parents became unemployed, these children began to suffer various psychological effects. One news report summarized this psychological impact as follows: “For many families across the country, the greatest damage inflicted by this recession has not necessarily been financial, but emotional and psychological. Children, especially, have become hidden casualties, often absorbing more than their parents are fully aware of. Several academic studies have linked parental job loss—especially that of fathers—to adverse impacts in areas like school performance and self-esteem.”
The emotional and psychological effects for children occur for at least two reasons. First, unemployed parents tend to experience extra stress and to become withdrawn. Second, married parents and unmarried partners often experience interpersonal conflict when one of them becomes unemployed. Both of these consequences of unemployment in turn affect children in a household where at least one parent is unemployed.
Children have suffered in other ways from the rise in unemployment. More children have become homeless as their households fell into poverty. In addition, children of an unemployed parent are more likely to repeat a grade or, if they are adolescents, to drop out of school. Child abuse has probably also increased in families where a parent became unemployed.
In view of all these consequences for the children of the unemployed, the United States should do everything possible to put parents and other adults back to work and to help the children of unemployed parents deal with the devastating effects of the Great Recession.
Sources: Lovell & Isaacs, 2010; Luo, 2009
Corporations
One of the most important but controversial features of modern capitalism is the corporation, a formal organization that has a legal existence, including the right to sign contracts, that is separate from that of its members.
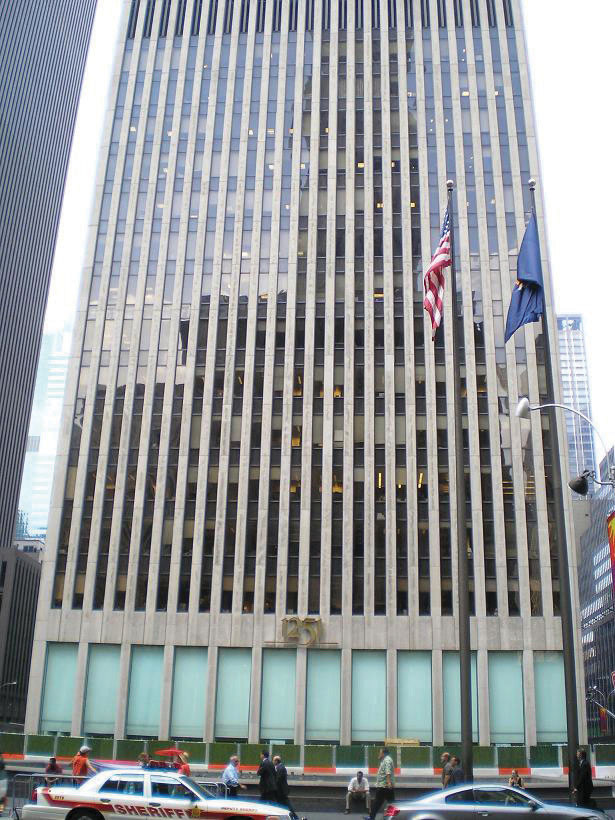
Corporations such as Exxon dominate the US economy. They employ thousands of workers, and their assets total many trillions of dollars.
Wikimedia Commons – CC BY-SA 2.5.
Adam Smith, the founder of capitalism, envisioned that individuals would own the means of production and compete for profit, and this is the model the United States followed in its early stage of industrialization. After the Civil War, however, corporations quickly replaced individuals and their families as the owners of the means of production and as the competitors for profit. As corporations grew following the Civil War, they quickly tried to control their markets by, for example, buying up competitors and driving others out of business. To do so, they engaged in bribery, kickbacks, and complex financial schemes of dubious ethics. They also established factories and other workplaces with squalid conditions. Their shady financial practices won their chief executives the name “robber barons” and led the federal government to pass the Sherman Antitrust Act of 1890 designed to prohibit restraint of trade that raised prices (Hillstrom & Hillstrom, 2005).
More than a century later, corporations have increased in both number and size. Although several million US corporations exist, most are fairly small. Each of the largest five hundred, however, has an annual revenue exceeding $4.3 billion (2011 data) and employs thousands of workers. Their total assets run into the trillions of dollars (Fortune, 2011). It is no exaggeration to say they control the nation’s economy, as together they produce most of the US private sector output, employ millions of people, and have revenues equal to most of the US gross domestic product. In many ways, the size and influence of corporations stifle the competition that is one of the hallmarks of capitalism. For example, several markets, including that for breakfast cereals, are controlled by four or fewer corporations. This control reduces competition because it reduces the number of products and competitors, and it thus raises prices to the public (Parenti, 2011).
The last few decades have seen the proliferation and rise of the multinational corporation, a corporation with headquarters in one nation but with factories and other operations in many other nations (Wettstein, 2009). Multinational corporations centered in the United States and their foreign affiliates have more than $17 trillion in assets and employ more than 31 million people (US Census Bureau, 2012). The assets of the largest multinational corporations exceed those of many of the world’s nations. Often their foreign operations are in poor nations, whose low wages make them attractive sites for multinational corporation expansion. Many multinational employees in these nations work in sweatshops at very low pay and amid substandard living conditions. Critics of this practice say multinationals not only mistreat workers in poor nations but also exploit these nations’ natural resources. In contrast, defenders of the practice say multinationals are bringing jobs to poor nations and helping them achieve economic growth. As this debate illustrates, the dominance of multinational corporations will certainly continue to spark controversy.
As we first discussed in Chapter 8 “Crime and Criminal Justice”, another controversial aspect of corporations is the white-collar crime in which they engage (Rosoff, Pontell, & Tillman, 2010). Price fixing by corporations costs the US public some $60 billion annually (Simon, 2008). Workplace-related illnesses and injuries that could have been prevented if companies had safe workplaces kill about 50,000 workers each year (American Federation of Labor and Congress of Industrial Organizations, 2011). An estimated 10,000 US residents die annually from unsafe products, including contaminated food (Consumer Product Safety Commission, 2010; Young, 2010). All in all, corporate lawbreaking and neglect probably result in almost 100,000 deaths annually and cost the public more than $400 billion (Barkan, 2012).
In sum, corporations are the dominant actors in today’s economy. They provide most of our products and many of our services and employ millions of people. It is impossible to imagine a modern industrial system without corporations. Yet they often stifle competition, break the law, and, according to their critics, exploit people and natural resources in developing nations.
Economic Inequality
In 2011, the Occupy Wall Street movement gave national attention to economic inequality by emphasizing the differences between the “1%” and the “99%.” Proclaiming “We are the 99%,” they decried the concentration of wealth in the richest of the rich and the growing inequality of the last few decades. (See Note 12.24 “People Making a Difference”.) The issue of economic inequality merits further attention here.
People Making a Difference
Occupy Wall Street
Before 2011, economic inequality in the United States certainly existed and in fact had increased greatly since the 1970s. However, although economic inequality was a topic of concern to social scientists, it was not a topic of concern to the general news media. Because the news media generally ignored economic inequality, it was also not a topic of concern to the general public.
That all changed beginning on September 17, 2011, when hundreds of people calling themselves “Occupy Wall Street” marched through the financial district in New York City before dozens encamped overnight and for weeks to come. Occupy Wall Street took these actions to protest the role of major banks and corporations in the economic collapse of 2007 and 2008 and to call attention to their dominance over the political process. Within weeks, similar Occupy encampments had spread to more than one hundred cities in the United States and hundreds more across the globe. “We are the 99%,” they said again and again, as “occupy” became a verb heard repeatedly throughout the United States.
By winter, almost all Occupy encampments had ended either because of legal crackdowns or because of the weather conditions. By that time, however, the Occupy protesters had won news media attention everywhere. In a December 2011 poll by the Pew Research Center, 44 percent of Americans supported the Occupy Wall Street movement, while 35 percent opposed it. Almost half (48 percent) said they agreed with the concerns raised by the movement, compared to 30 percent who said they disagreed with these concerns. In the same poll, 61 percent said the US economic system “unfairly favors the wealthy,” while 36 percent said it was fair to all Americans. In a related area, 77 percent said “there is too much power in the hands of a few rich people and corporations.” In all these items, there was a notable difference by political party preference. For example, 91 percent of Democrats agreed that a few rich people and corporations have too much power, compared to 80 percent of Independents and only 53 percent of Republicans.
Regardless of these political differences, Occupy Wall Street succeeded in bringing economic inequality and related issues into the national limelight. In just a few short months in 2011, it made a momentous difference.
Sources: Pew Research Center, 2011; vanden Heuvel, 2012
Let’s start by defining economic inequality, which refers to the extent of the economic difference between the rich and the poor. Because most societies are stratified, there will always be some people who are richer or poorer than others, but the key question is how much richer or poorer they are. When the gap between them is large, we say that much economic inequality exists; when the gap between them is small, we say that relatively little economic inequality exists.
Considered in this light, the United States has a very large degree of economic inequality. A common way to examine inequality is to rank the nation’s families by income from lowest to highest and then to divide this distribution into fifths. Thus we have the poorest fifth of the nation’s families (or the 20 percent of families with the lowest family incomes), a second fifth with somewhat higher incomes, and so on until we reach the richest fifth of families, or the 20 percent with the highest incomes. We then can see what percentage each fifth has of the nation’s entire income. Figure 12.4 “Share of National Income Going to Income Fifths, 2010” shows such a calculation for the United States. The poorest fifth enjoys only 3.3 percent of the nation’s income, while the richest fifth enjoys 50.2 percent. Another way of saying this is that the richest 20 percent of the population have as much income as the remaining 80 percent of the population.
Figure 12.4 Share of National Income Going to Income Fifths, 2010
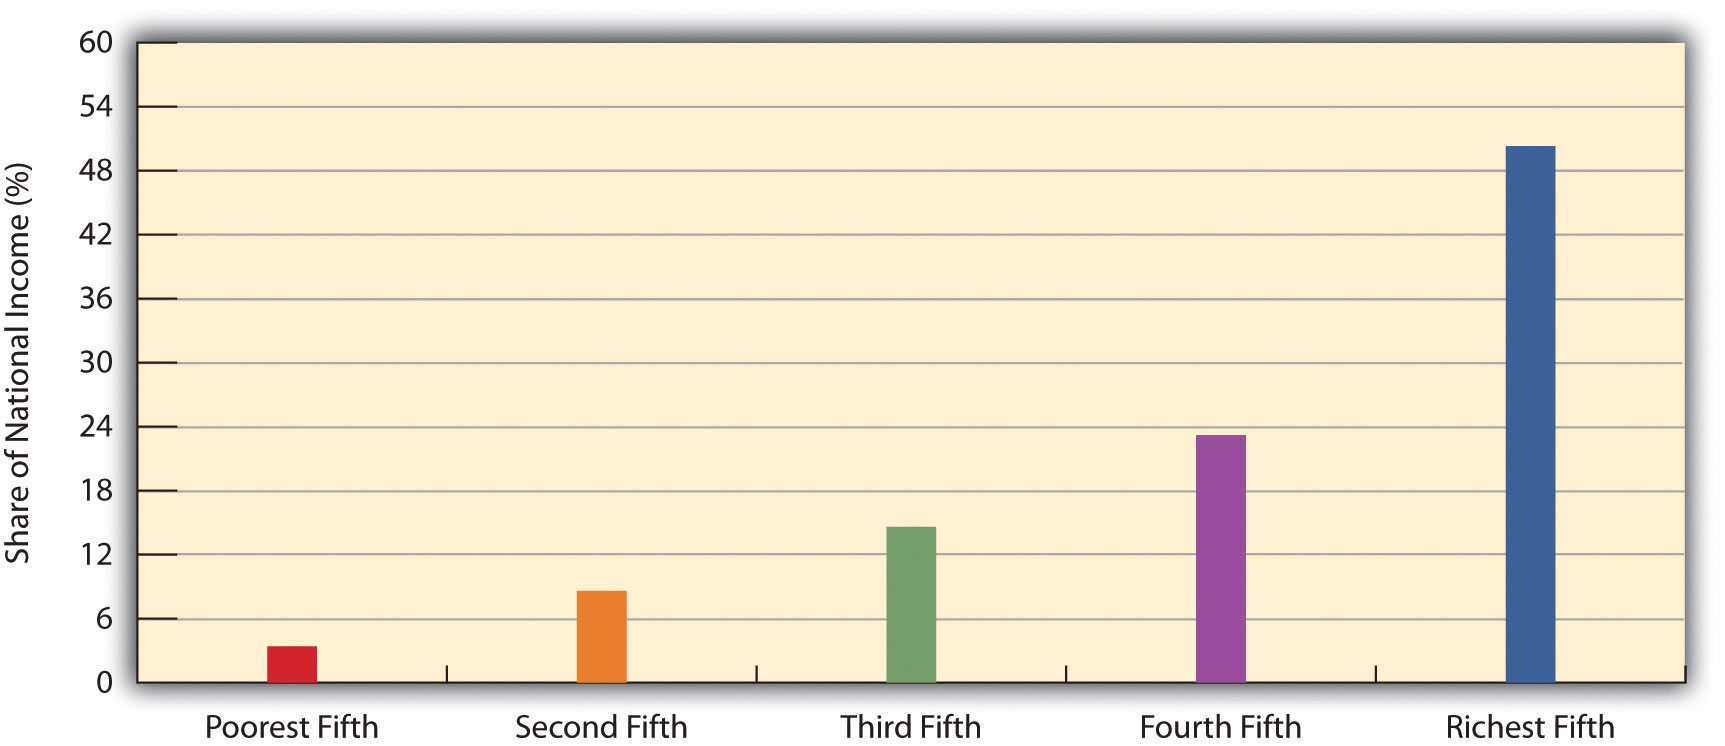
Source: Data from US Census Bureau. (2012). Statistical abstract of the United States: 2012. Washington, DC: US Government Printing Office. Retrieved from http://www.census.gov/compendia/statab.
This degree of inequality is the largest in the industrialized world. Figure 12.5 “Income Inequality around the World” compares the inequality among several industrialized nations by dividing the median income of households in the ninetieth percentile (meaning they have more income than 90 percent of all households) by the median income of households in the tenth percentile (meaning they have more income than only 10 percent of all households); the higher this resulting ninetieth percentile/tenth percentile ratio, the greater a nation’s inequality. The ratio for the United States far exceeds that for any other nation.
Figure 12.5 Income Inequality around the World
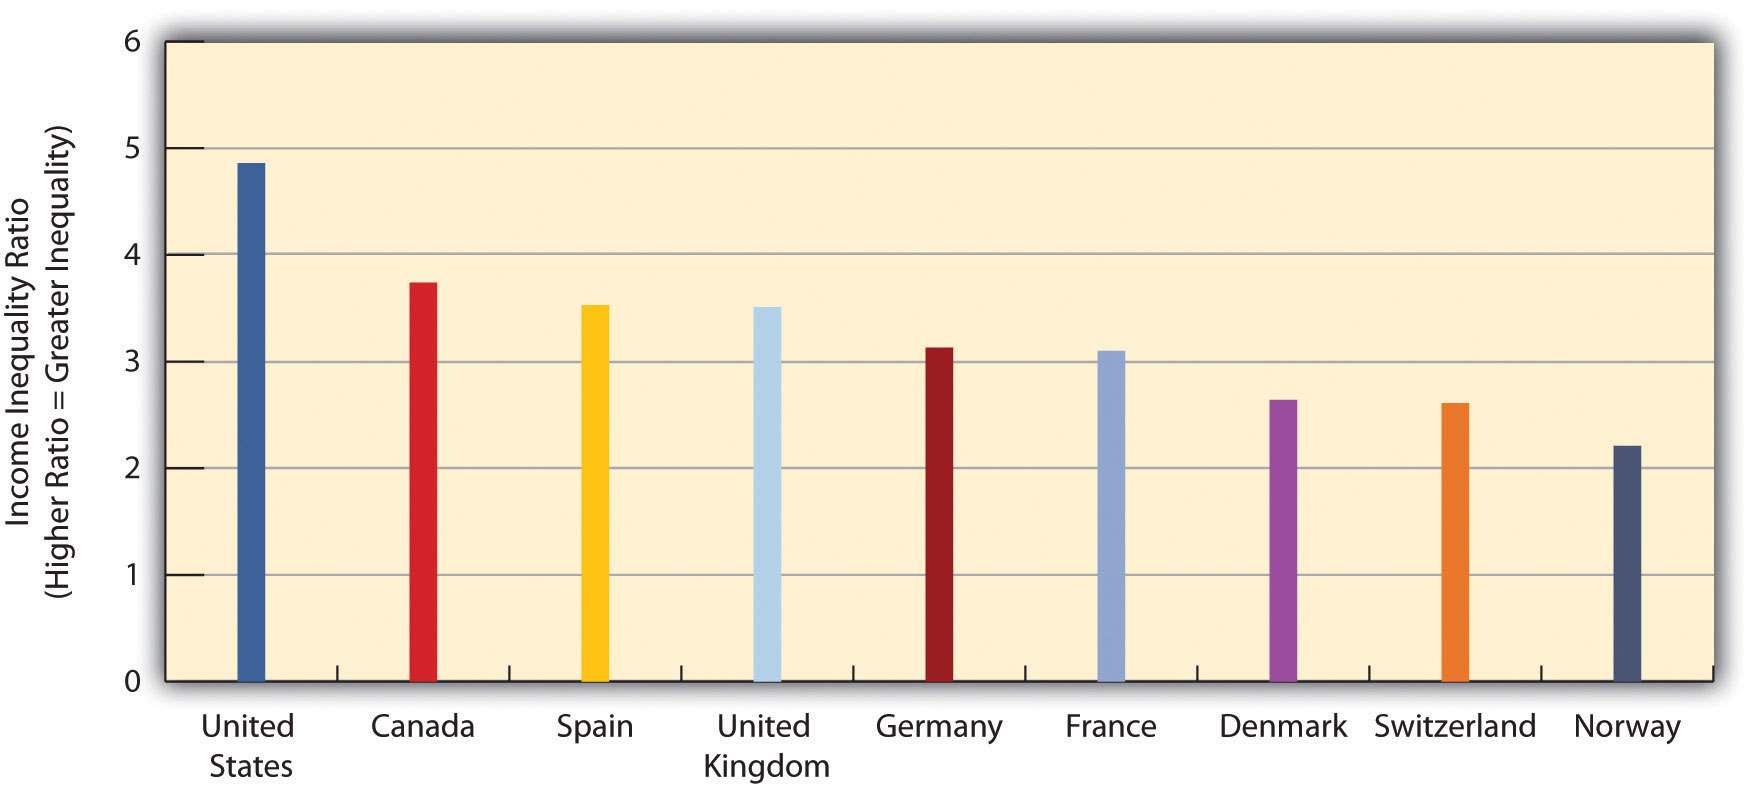
Ratio of median income of richest 10 percent in each nation to that of poorest 10 percent.
Source: Data from Mishel, L., Bernstein, J., & Shierholz, H. (2009). The state of working America 2008/2009. Ithaca, NY: ILR Press.
The Role of Tax Policy
Economic inequality in the United States has increased during the last three decades. The loss of manufacturing jobs and unions accounts for some of this increase. However, a primary reason for the rising inequality has been tax policy. More specifically, the federal government has implemented steep cuts in the highest tax rates for income from salaries and wages and especially in tax rates for income from dividends and capital gains (Hacker & Pierson, 2011). This latter cut is especially important because dividends and capital gains account for a much larger share of the income of wealthy families than the income of ordinary families. To be more specific, dividends and capital gains account for only 0.7 percent of the income of the bottom four-fifths of the nation’s families, but for 18.8 percent of the income of the top fifth, 38.2 percent of the top 1 percent, and a striking 51.9 percent of the top 0.1 percent (Hungerford, 2011). In a related statistic, three-fourths of all capital gains are received by the top 1 percent (Krugman, 2012). Relative to its national wealth, the United States is the lowest-taxed industrial democracy in the world (Leonhardt, 2012).
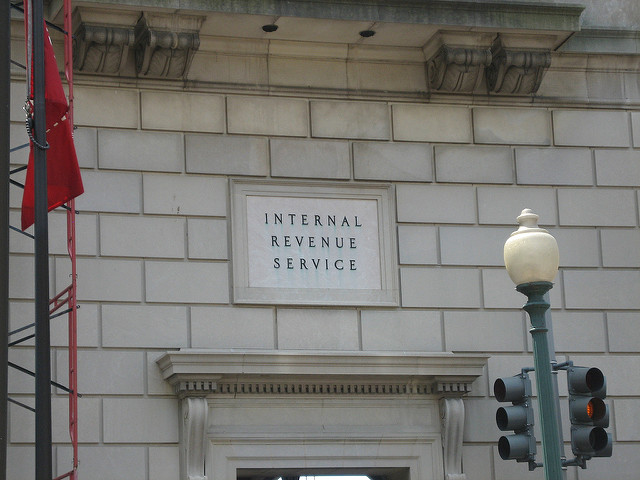
Tax rates for the very wealthy have declined dramatically since the 1970s. This decline has helped fuel a rise in economic inequality.
Martin Haesemeyer – The Internal Revenue Service – CC BY-NC-ND 2.0.
Keep this context in mind as we note that tax cuts in 2003 lowered the tax rate for dividends and capital gains from 28 percent to 15 percent. Meanwhile, the top tax rate for income from salaries and wages is 35 percent. Thus many very wealthy families and individuals pay a lower percentage of their income in taxes than many middle- and upper-middle-class families do because so much of the wealthy families’ income is from dividends and capital gains. In fact, the four hundred wealthiest families and individuals in the country pay only about 18 percent of their income in federal tax (Krugman, 2012). As the director of Citizens for Tax Justice explained, “The low taxes on capital gains and dividends are why people who make a ton of money, which is largely from investment income, do awfully well. The Warren Buffetts, the hedge fund managers—they pay really low tax rates” (Confessore, Kocieniewski, & Parker, 2011, p. A1). This fact prompts a critical question from Paul Krugman, winner of the Nobel Prize in economics: “Is there a good reason why the rich should bear a startlingly light tax burden?” His answer: “Such low taxes on the very rich are indefensible” (Krugman, 2012, p. A27).
The lowering of tax rates has helped make the nation’s wealthiest families even wealthier. After adjusting for inflation, their after-tax income grew by a much greater amount than that for the poorest families from 1979 to 2007. Income grew by only 18 percent for the poorest fifth but by 65 percent for the wealthiest fifth (excluding the top 1 percent), and it also grew by a whopping 275 percent for families in the top 1 percent (Congressional Budget Office, 2011). As a result, economic inequality increased. Figure 12.6 “Growth of Economic Inequality in the United States (Percentage Share of Total National Income)” shows that wealthiest 1 percent now have a much larger share of the nation’s total posttax income than they did in 1979, while the poorest fifth have a lower share. As the saying goes, the rich get richer, and the poor get poorer.
Figure 12.6 Growth of Economic Inequality in the United States (Percentage Share of Total National Income)
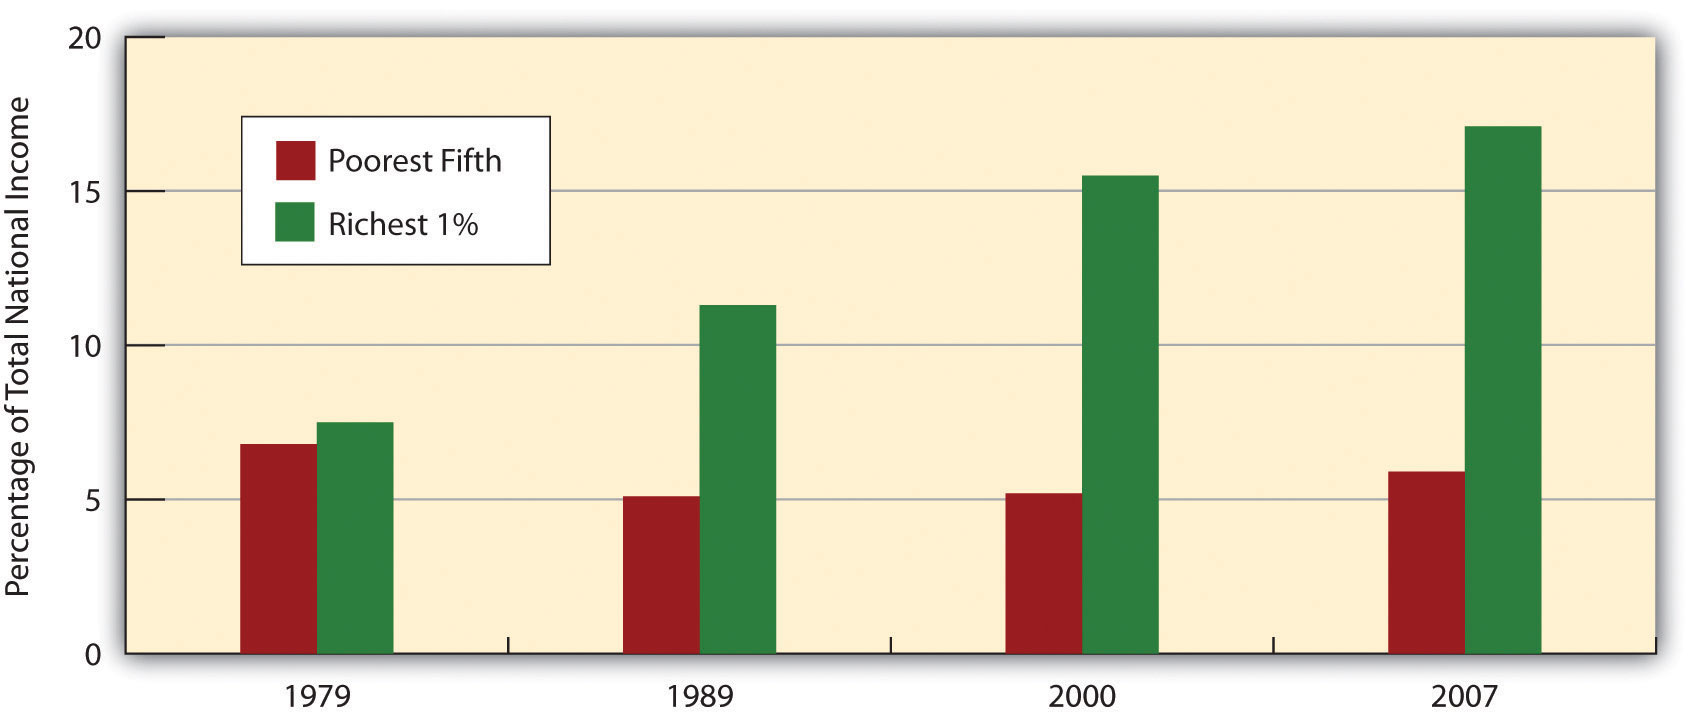
Source: Economic Policy Institute. (2011). Share of total income by income fifths and a breakdown of the top 20%. The State of working America. Washington, DC: Economic Policy Institute. Retrieved from http://stateofworkingamerica.org/charts/household-income-shares-1979-2007.
The Impact of Economic Inequality
Why should we care if economic inequality has increased and if the United States has the highest degree of inequality of all industrial democracies? One answer is that it is a matter of fairness. The United States is not only the wealthiest nation in the world; it is also a nation that historically has stressed that everyone is created equal and that everyone has an equal opportunity to pursue the “American dream” by becoming economically successful. Against this backdrop, a high degree of economic inequality is simply “un-American” and unfair.
Beyond this rather philosophical critique are more practical considerations. First, a high degree of economic inequality is strongly associated with a high degree of poverty and near poverty: If the rich are getting richer, there is normally less wealth to “go around,” and the poor get poorer. For the same reason, high economic inequality is also associated with a shrinking of the middle class. In the United States, as both poverty (and near poverty) and wealth have increased, the size of the middle class has reduced, as the chair of the Council of Economic Advisers has emphasized (Krueger, 2012).
Second, a high degree of economic inequality is also associated with low economic mobility (the movement of people up or down the socioeconomic ladder) (Krueger, 2012). As noted earlier, the United States is the most economically unequal of all industrial democracies. It also has lower economic mobility: Americans born into poverty or near poverty are less likely than their counterparts in other democracies to be able to move up the socioeconomic ladder (DeParle, 2012).
Next, high economic inequality may slow economic growth. This possible effect occurs for at least three reasons (Krueger, 2012). First, the wealthy tend to save their money rather than spend it. Second, a shrinking middle class means there is less spending by the middle class to stimulate the economy. Third, workers’ morale is likely to be lower in a society with higher economic inequality, and their lower morale decreases their productivity. As the chair of the Council of Economic Advisers has stated, “The evidence suggests that a growing middle class is good for the economy, and that a more fair distribution of income would hasten economic growth. Businesses would benefit from restoring more fairness to the economy by having more middle class customers, more stable markets, and improved employee morale and productivity” (Krueger, 2012).
Finally, many social scientists consider nations with high degrees of economic inequality to be “unhealthy societies,” to quote the title of a book on this issue (Wilkinson, 1996). Economic inequality is thought to undermine social cohesion and increase polarization, and also to cause other problems (Barash, 2012; Wilkinson & Pickett, 2011). Among the world’s industrial nations, higher degrees of economic inequality are associated with worse physical and mental health, lower life expectancy, and higher rates of violent crime. High economic inequality, then, is a matter not only of fairness but also of life and death.
Tax Evasion
Another significant problem in the American economy is tax evasion. The Internal Revenue Service (IRS) periodically estimates the amount of tax evasion and derives a figure it calls the tax gap: the difference between what Americans owe in federal taxes and what they actually pay. Much of the annual tax gap results from the failure of professionals such as physicians and attorneys to report self-employment income and from the claiming of false deductions by wealthy individuals and families (Braithwaite, 2009).
In January 2012, the IRS released its estimate of the tax gap for 2006. The initial tax gap was $450 billion. After payment of late taxes and certain enforcement efforts, this gap was reduced to $385 billion, still an astronomical figure; tax evasion by corporations amounted for about $70 billion of this amount. The total tax gap is about twenty times greater than the annual economic loss from property crimes such as burglary and motor vehicle theft. In 2006, the federal budget deficit was $248 billion. If everyone had paid the taxes they owed, there would have been no deficit at all, and the federal government in fact would have had a surplus of $137 billion (Pizzigati, 2012).
Despite the huge problem of tax evasion, budget cuts in 2011 weakened the ability of the IRS to enforce the tax code. In 2012, the IRS had 3,000 fewer employees working in enforcement than it had in 2010 (Pizzigati, 2012).
Crime in the Workplace
Employee theft costs about $19.5 billion annually. Workers’ dissatisfaction with various aspects of their jobs is a major reason for this form of theft.
A. Golden – the US$ 3 TRILLION HEIST – CC BY-NC-ND 2.0.
An unfortunate fact about work in the United States is crime in the workplace, which is the last problem in work and the economy that we will examine. Two major types of such crime exist: employee theft and workplace violence.
Employee Theft
Employee theft takes two forms: pilferage and embezzlement. Pilferage involves the stealing of goods, while embezzlement involves the stealing of money in its various dimensions (cash, electronic transactions, etc.). Whichever form it takes, employee theft is so common that is has been called a “widespread, pervasive, and costly form of crime” (Langton, Piquero, & Hollinger, 2006, p. 539). It is estimated that about 75 percent of employees steal at least once from their employers and that the annual amount of employee theft is $19.5 billion (National Retail Federation, 2007).
Employee theft occurs for many reasons, but a common reason is worker dissatisfaction with various aspects of their job. They may think their wages or salaries are too low, they may feel they have been treated unfairly by their employer, and so forth. As the estimates of the amount of employee theft suggest, this form of theft is not condemned by many people, and, indeed, many workplaces have informal norms that approve of certain forms of theft—for example, it is OK to steal inexpensive objects such as (depending on the workplace) utensils, food, pencils and pens, or toilet paper. Not surprisingly, embezzlement is often more costly to an employer than pilferage; although it can involve just a few dollars from a cash register, it can also involve hundreds of thousands or millions of dollars acquired through more sophisticated means.
When we think of employee theft, we probably usually think of theft by blue-collar or lower white-collar employees. However, physicians, attorneys, and other professionals also steal from their patients/clients or from the government, even if their form of theft is often much more complex and sophisticated than what the term “employee theft” may usually imply. Attorneys may bill their clients for work that was never done, and physicians may bill Medicare or private insurance for patients they never saw or for procedures that were never performed. We call this form of “employee” theft professional fraud. Fraud by physicians and other health-care professionals (including nursing homes and medical testing laboratories) is thought to amount to $100 billion every year (Rosoff et al., 2010), a figure that far exceeds the $19.5 billion in “conventional” employee theft and the similar figure lost to property crime (robbery, burglary, larceny, and motor vehicle theft).
Workplace Violence
In January 2012, a lumber company employee in North Carolina entered the company’s warehouse armed with a twelve-gauge shotgun. He shot and killed three coworkers and critically wounded another coworker. He then returned home, shot himself in the head, and later died at a hospital. A news report described the gunman as a “disgruntled” employee (Muskal, 2012).

About five hundred homicides occur at workplaces every year. The majority of these homicides result from robberies, not from the actions of disgruntled workers.
Pixabay – CC0 Public Domain.
Many people die or are injured by acts of violence at their workplaces every year in the United States. In 2008, 517 people were slain at their workplaces, according to the US Bureau of Labor Statistics. As disturbing as this number was, it represented a sharp drop from the numbers that prevailed a decade earlier, when 1,080 workplace homicides occurred in 1994. From 2003 through 2008, an average of 497 workplace homicides occurred every year (Needleman, 2010).
In terms of who is involved and the reasons for their involvement, three kinds of workplace homicides are the most common. The first and by far the most common type is homicide as the result of robbery. This category includes the many store clerks, gas station attendants, taxi drivers, and other employees who are slain during a robbery, as well as police who are killed as they try to stop a robbery or apprehend the offender. The second category is homicide committed as an act of domestic violence; in this type, the offender, almost always a man, seeks out his wife or girlfriend (or ex-wife or ex-girlfriend) at her workplace and kills her. The third category involves disgruntled workers, such as the North Carolina lumber employee just discussed, who kill one or more people at their workplace whom they blame for problems the killers have been having. Although this type of homicide is the type that the phrase “workplace violence” or “workplace killings” usually brings to mind, it is actually the least common of the three types listed here (Fox, 2010).
Key Takeaways
- The move to a postindustrial economy has resulted in a loss of jobs and wages in the United States, thanks in part to capital flight and outsourcing.
- Unemployment soared after the Great Recession that began in late 2007. Joblessness has significant consequences for the financial and psychological well-being of the millions of people who are unemployed.
- Economic inequality has greatly increased since the 1970s, thanks in large part to changes in the tax code that favored the wealthy.
- Corporations often engage in white-collar crime that costs hundreds of billions of dollars annually and results in tens of thousands of deaths.
For Your Review
- Write a brief essay in which you discuss the benefits and disadvantages of corporations in modern society.
- Write a brief essay in which you summarize the problems associated with increasing economic inequality.
- Fewer workers belong to labor unions now than just a few decades ago. Do you think this is a good development or a bad development? Explain your answer.
- Think of a job you now have or your most recent job if you are currently not employed. On a scale of 1 (very dissatisfied) to 10 (very satisfied), how satisfied are you (were you) with your job? Explain why you have (had) this level of satisfaction.
References
American Federation of Labor and Congress of Industrial Organizations. (2011). Death on the job: The toll of neglect. Washington, DC: Author.
Barash, D. (2012, January 13). The wanton wages of income inequality. The Chronicle of Higher Education. Retrieved from http://chronicle.com/blogs/brainstorm/the-wages-of-inequality/43020?sid=pm&utm_source=pm&utm_medium=en.
Barkan, S. E. (2012). Criminology: A sociological understanding (5th ed.). Upper Saddle River, NJ: Prentice Hall.
Bertrand, M., & Mullainathan, S. (2003). Are Emily and Greg more employable than Lakisha and Jamal? A field experiment on labor market discrimination (Working Paper No. 9873). Cambridge, MA: National Bureau of Economic Research. Retrieved from http://papers.nber.org/papers/w9873.pdf.
Braithwaite, V. (2009). Tax evasion. In M. Tonry (Ed.), The Oxford handbook of crime and public policy (pp. 381–405). New York, NY: Oxford University Press.
Bureau of Labor Statistics. (2012). 2012 employment and earnings online. Washington, DC: Bureau of Labor Statistics. Retrieved from http://www.bls.gov/opub/ee/home.htm.
Confessore, N., Kocieniewski, D., & Parker, A. (2011, January 18). Romney shares some tax data; critics pounce. New York Times, p. A1.
Congressional Budget Office. (2011). Trends in the distribution of household income between 1979 and 2007. Retrieved from http://www.cbo.gov/ftpdocs/124xx/doc12485/WebSummary.pdf.
DeParle, J. (2012, January 5). Harder for Americans to rise from lower rungs. New York Times, p. A1.
Dubofsky, M., & Dulles, F. R. (2010). Labor in America: A history (8th ed.). Wheeling, IL: Harlan Davidson.
Economic Policy Institute. (2012). The state of working America. Retrieved January 17, 2012, from http://stateofworkingamerica.org.
Fortune. (2011). Fortune 500. Retrieved January 14, 2012, from http://money.cnn.com/magazines/fortune/fortune500/2011/full_list.
Fox, J. A. (2010). Workplace homicide: What is the risk? Retrieved from http://boston.com/community/blogs/crime_punishment/2010/08/workplace_homicide_the_risks.html.
Hacker, J. S., & Pierson, P. (2011). Winner-take-all politics: How Washington made the rich richer—and turned its back on the middle class. New York, NY: Simon & Schuster.
Hall, D. (2011, November 3). As the manufacturing sector goes, so goes America? Retrieved January 16, 2012, from http://www.epi.org/blog/manufacturing-sector-american-economy.
Herbert, B. (2010, August 10). The horror show. New York Times, p. A25.
Hillstrom, K., & Hillstrom, L. C. (Eds.). (2005). The industrial revolution in America. Santa Barbara, CA: ABC-CLIO.
Hirsch, B., & Macpherson, D. (2011). Union membership and coverage database from the CPS. Retrieved from http://unionstats.com.
Hungerford, T. L. (2011). Changes in the distribution of income among tax filers between 1996 and 2006: The role of labor income, capital income, and tax policy. Washington, DC: Congressional Research Service.
Krueger, A. B. (2012). The rise and consequences of inequality in the United States. Retrieved January 19, 2012, from http://www.americanprogress.org/events/2012/01/pdf/krueger.pdf.
Krugman, P. (2012, January 20). Taxes at the top. New York Times, p. A27.
Langton, L., Piquero, N. L., & Hollinger, R. C. (2006). An empirical test of the relationship between employee theft and low self-control. Deviant Behavior, 27, 537–565.
Leonhardt, D. (2012, January 20). Why taxes aren’t as high as they seem. New York Times, p. A15.
Levine, L. (2012). Offshoring (or offshore outsourcing) and job loss among US workers (CRS Report RL32292). Retrieved January 17, 2012, from http://forbes.house.gov/UploadedFiles/CRS_-_Offshoring_and_Job_Loss_Among_U_S__Workers.pdf.
Lovell, P., & Isaacs, J. B. (2010). Families of the recession: Unemployed parents & their children. Washington, DC: Brookings Institution.
Luo, M. (2009, November 12). Job woes exacting a toll on family life. New York Times, p. A1.
McDonald, S., Nan, L., & Ao, D. (2009). Networks of opportunity: Gender, race, and job leads. Social Problems, 56(3), 385–402.
Mills, C. W. (1959). The sociological imagination. London, United Kingdom: Oxford University Press.
Mishel, L., Bernstein, J., & Shierholz, H. (2009). The state of working America 2008/2009. Ithaca, NY: ILR Press.
Morin, R., & Kochhar, R. (2010). Lost income, lost friends—and loss of self-respect: The impact of long-term unemployment. Washington, DC: Pew Research Center.
Muskal, M. (2012). Man Shoots 4 Co-Workers, Killing 3, Authorities Say. Los Angeles times, January 12, A12.
National Retail Federation. (2007, June 11). Retail losses hit $41.6 billion last year, according to national retail security survey [Press release]. Retrieved from http://www.nrf.com/modules.php?name=News&op=viewlive&sp_id=318.
Needleman, S. E. (2010, August 10). When violence strikes the workplace. The Wall Street Journal. Retrieved from http://online.wsj.com/article/SB10001424052748704164904575421560153438240.html?mod=googlenews_wsj.
Pager, D. (2003). The mark of a criminal record. American Journal of Sociology, 108, 937–975.
Pager, D., Bonikowski, B., & Western, B. (2009). Discrimination in a low-wage labor market: A field experiment. American Sociological Review, 74(5), 777–799.
Parenti, M. (2011). Democracy for the few (9th ed.). Belmont, CA: Wadsworth.
Pizzigati, S. (2012). Law and order 24/7, except at tax time. Retrieved January 14, 2012, from http://toomuchonline.org/tax-gap-law-and-order.
Rosoff, S. M., Pontell, H. N., & Tillman, R. (2010). Profit without honor: White collar crime and the looting of America (5th ed.). Upper Saddle River, NJ: Prentice Hall.
Shierholz, H. (2012, January 6). A solid step in the right direction for the labor market. Retrieved January 17, 2012, from http://www.epi.org/publication/december-2011-jobs-picture.
Simon, D. R. (2008). Elite deviance (9th ed.). Boston, MA: Allyn and Bacon.
US Census Bureau. (2012). Statistical abstract of the United States: 2012. Washington, DC: US Government Printing Office. Retrieved from http://www.census.gov/compendia/statab.
US Consumer Product Safety Commission. (2010, April 15). 2010 annual report to the president and the Congress. Washington, DC: Author.
vanden Heuvel, K. (2012, January 26) The occupy effect. The Nation. Retrieved from http://www.thenation.com/blog/165883/occupy-effect?rel=emailNation.
Wettstein, F. (2009). Multinational corporations and global justice: Human rights obligations of a quasi-governmental institution. Stanford, CA: Stanford Business Books.
Wilkinson, R. G. (1996). Unhealthy societies: The afflictions of inequality. New York, NY: Routledge.
Wilkinson, R., & Pickett, K. (2011). The spirit level: Why greater equality makes societies stronger. New York, NY: Bloomsbury Press.
Young, S. (2010, April 15). E. coli cases down in 2009, CDC says. CNN Health. Retrieved from http://articles.cnn.com/2010-04-15/health/foodborne.illness.cdc_1_foodnet-cases-of-e-coli-hemolytic-uremic-syndrome?_s= PM:HEALTH.
