15.2 Population
Learning Objectives
- Describe the central concepts of the study of demography.
- Understand demographic transition theory and how it compares with the views of Thomas Malthus.
- Explain why some experts feel that world hunger does not result from overpopulation.
- Provide examples of how US history is marked by anti-immigrant prejudice.
Population change often has weighty consequences throughout a society. As we think about population change, we usually think about and worry about population growth, but population decline is also a concern. Consider the experience of Michigan (Dzwonkowski, 2010). Like several other northern states, Michigan has lost population during the past few decades. Its birth rate has declined by 21 percent from 1990, and elementary school populations dropped as a result. Several schools lost so many students that they had to close, and others are in danger of closing. In addition, many more people have been moving out of Michigan than moving in. Because many of those moving out are young, college-educated adults, they take with them hundreds of millions of dollars in paychecks away from Michigan’s economy and tax revenue base. They also leave behind empty houses and apartments that help depress the state’s real estate market. Because of the loss of younger residents from the declining birth rate and out-migration, Michigan’s population has become older on the average. This shift means that there is now a greater percentage of residents in their older years who need state services.
Among other consequences, then, Michigan’s population decline has affected its economy, educational system, and services for its older residents. While Michigan and other states are shrinking, states in the southern and western regions of the nation are growing, with their large cities becoming even larger. This population growth also has consequences. For example, schools become more crowded, pressuring communities to hire more teachers and either enlarge existing schools or build new ones. The population growth also strains hospitals, social services, and many other sectors of society.
This brief discussion of US cities underscores the various problems arising from population growth and decline. These are not just American problems, as they play out across the world. The remainder of this section introduces the study of population and then examines population problems in greater depth.
The Study of Population
We have commented that population change is an important source of other changes in society. The study of population is so significant that it occupies a special subfield within sociology called demography. To be more precise, demography is the study of changes in the size and composition of population. It encompasses several concepts: fertility and birth rates, mortality and death rates, and migration. Let’s look at each of these briefly.
Fertility and Birth Rates
Fertility refers to the number of live births. Demographers use several measures of fertility. One measure is the crude birth rate, or the number of live births for every 1,000 people in a population in a given year. We call this a “crude” birth rate because the population component consists of the total population, not just the number of women or even the number of women of childbearing age (commonly considered 15–44 years).
A second measure is the general fertility rate (also just called the fertility rate or birth rate), or the number of live births per 1,000 women aged 15–44 (i.e., of childbearing age). The US general fertility rate for 2010 was about 64.7 (i.e., 64.7 births per 1,000 women aged 15–44) (Sutton & Hamilton, 2011).
A third measure is the total fertility rate, or the number of children an average woman is expected to have in her lifetime (taking into account that some women have more children and some women have fewer or no children). This measure often appears in the news media and is more easily understood by the public than either of the first two measures. In 2010, the US total fertility rate was about 1.93 (or 1,930 births for every 1,000 women) (Hamilton, Martin, & Ventura, 2011).

Demographers use several measures of fertility. The general fertility rate refers to the number of live births per 1,000 women aged 15–44. The US general fertility rate is about 65.5.
Daniel – Delivery – CC BY-NC-ND 2.0.
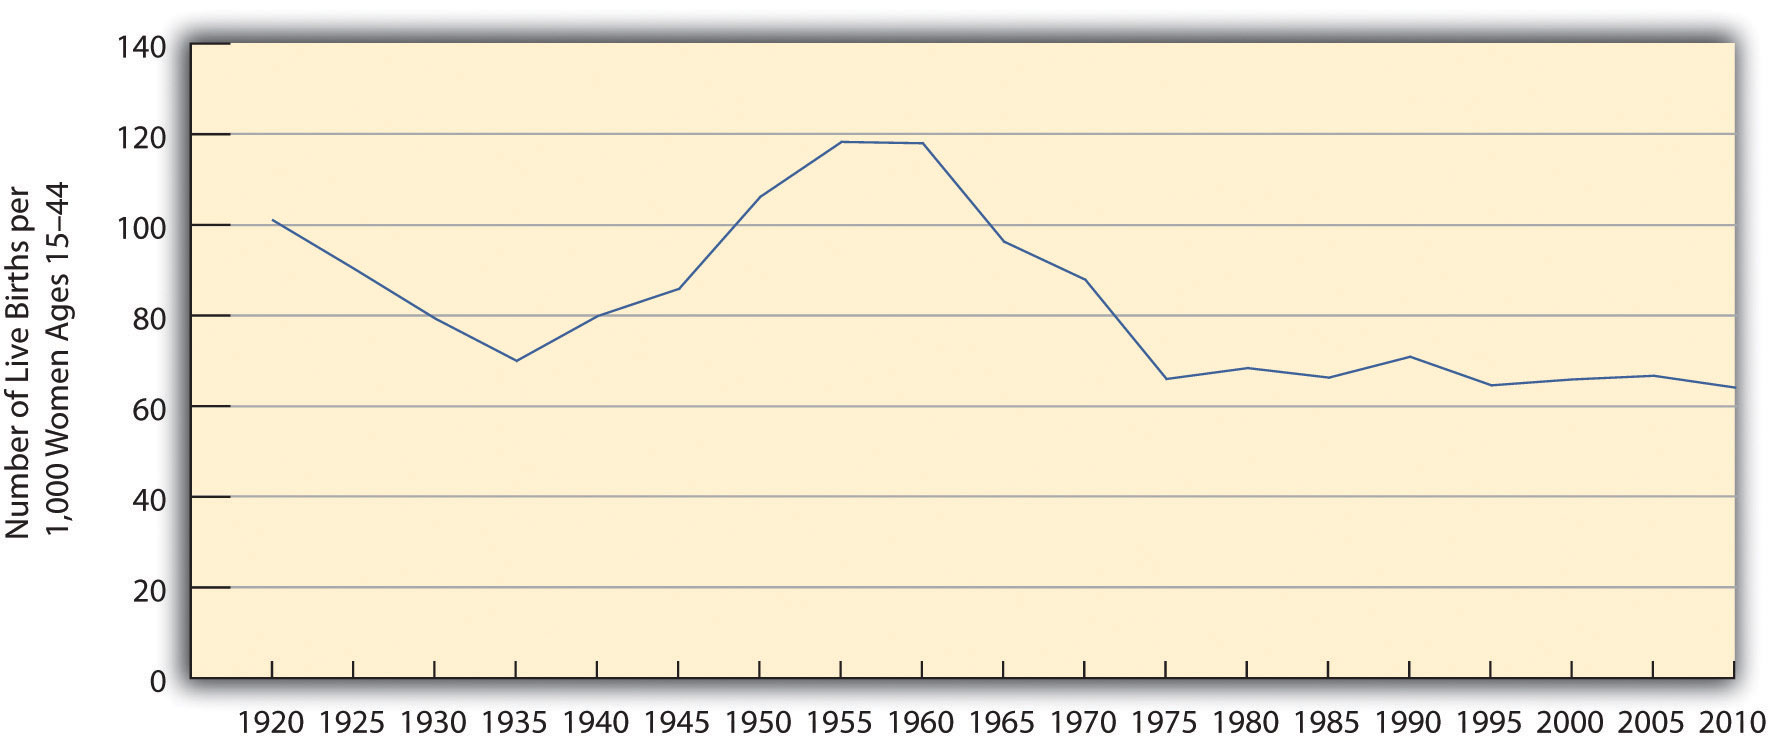
As Figure 15.1 “US General Fertility Rate, 1920–2010” indicates, the US general fertility rate has changed a lot since 1920, dropping from 101 (per 1,000 women aged 15–44) in 1920 to 70 in 1935, during the Great Depression, before rising afterward until 1955. (Note the very sharp increase from 1945 to 1955, as the post–World War II baby boom began.) The fertility rate then fell steadily after 1960 until the 1970s but has remained rather steady since then, fluctuating only slightly between 65 and 70 per 1,000 women aged 15–44.
Figure 15.1 US General Fertility Rate, 1920–2010
Sources: Data from Hamilton, B. E., Martin, J. A., & Ventura, S. J. (2011). Births: Preliminary data for 2010. National Vital Statistics Reports, 60(2), 1–13; Martin, J. A., Hamilton, B. E., Sutton, P. D., Ventura, S. J., Menacker, F., Kirmeyer, S., & Mathews, T. J. (2009). Births: Final data for 2006. National Vital Statistics Reports, 57(7), 1–102; US Census Bureau. (1951). Statistical abstract of the United States: 1951. Washington, DC: US Government Printing Office.
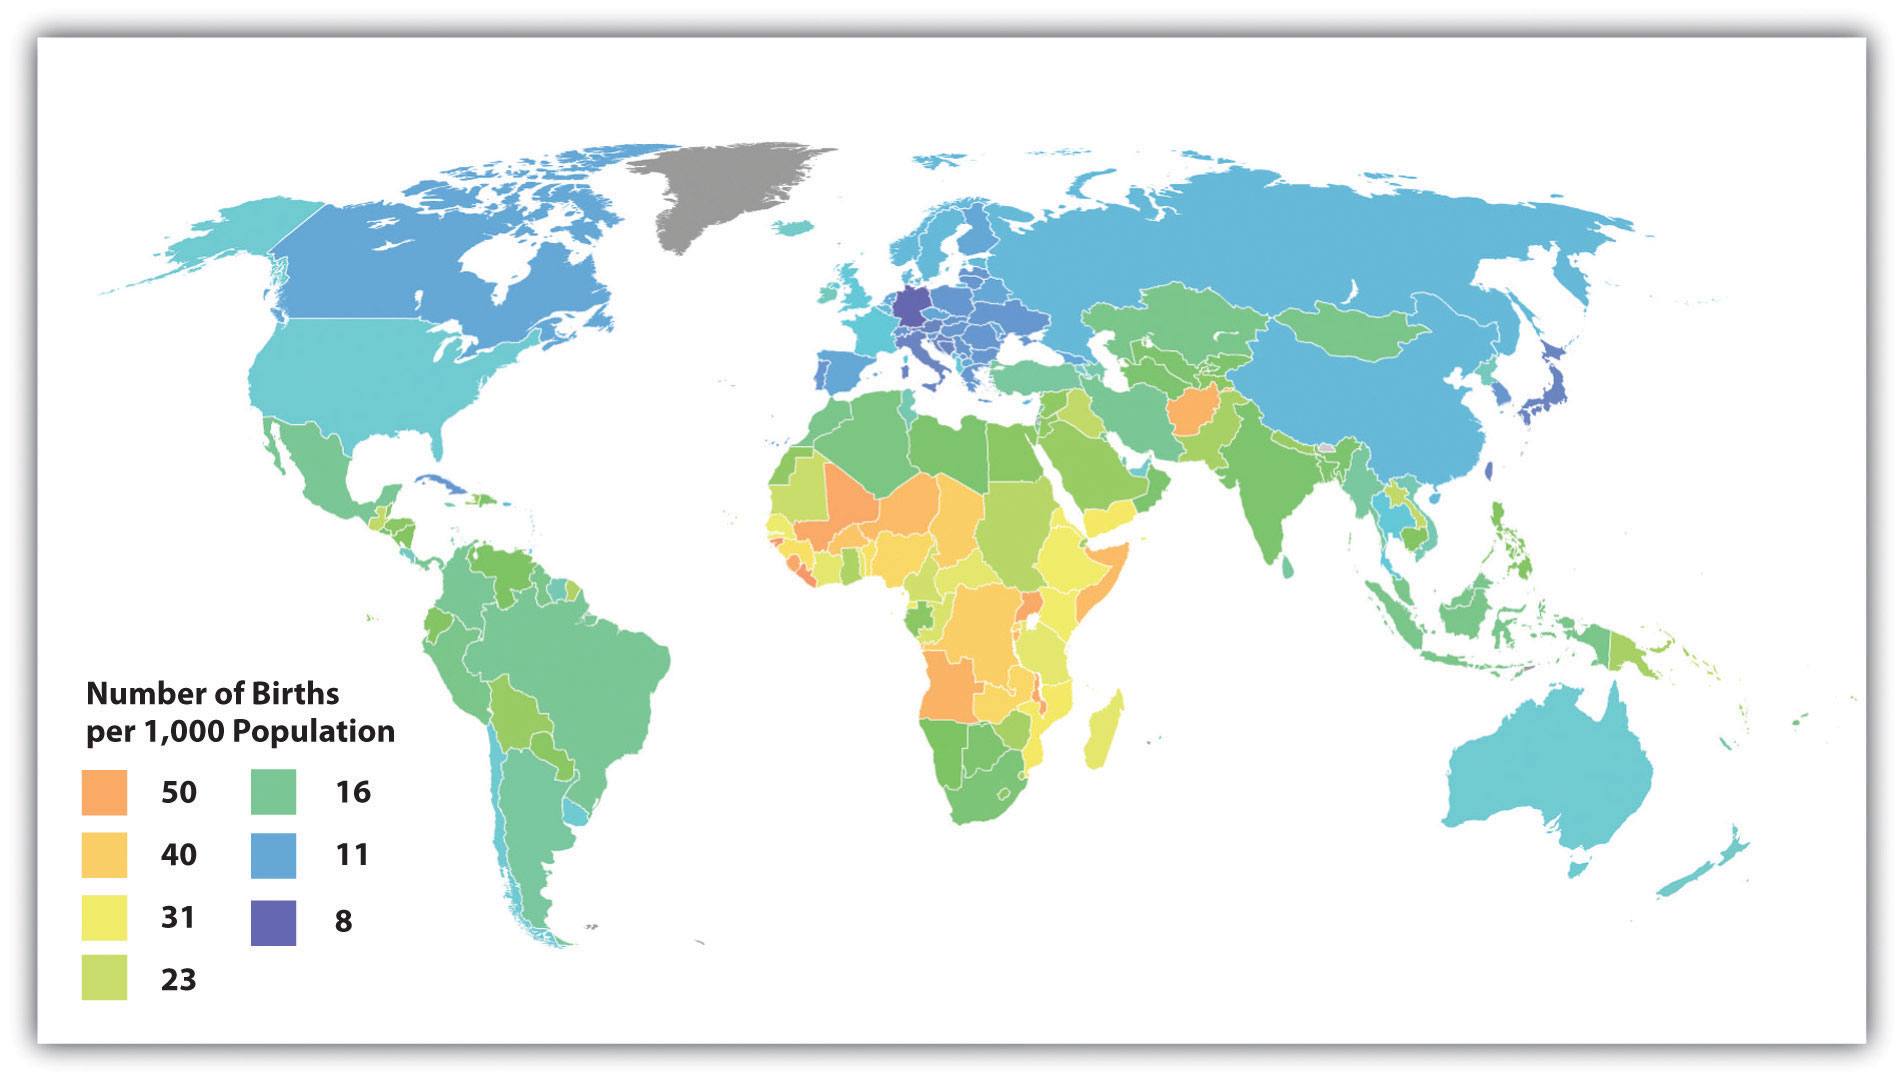
Fertility rates differ around the world and are especially high in poor nations (see Figure 15.2 “Crude Birth Rates around the World, 2008 (Number of Births per 1,000 Population)”). Demographers identify several reasons for these high rates (Weeks, 2012).
Figure 15.2 Crude Birth Rates around the World, 2008 (Number of Births per 1,000 Population)
Source: Adapted from http://en.wikipedia.org/wiki/File:Birth_rate_figures_for_countries.PNG.
First, poor nations are usually agricultural ones. In agricultural societies, children are an important economic resource, as a family will be more productive if it has more children. This means that families will ordinarily try to have as many children as possible. Second, infant and child mortality rates are high in these nations. Because parents realize that one or more of their children may die before adulthood, they have more children to make up for the anticipated deaths.
A third reason is that many parents in low-income nations prefer sons to daughters, and, if a daughter is born, they try again for a son. Fourth, traditional gender roles are often very strong in poor nations, and these roles include the belief that women should be wives and mothers above all. With this ideology in place, it is not surprising that women will have several children. Finally, contraception is uncommon in poor nations. Without contraception, many more pregnancies and births certainly occur. For all these reasons, then, fertility is much higher in poor nations than in rich nations.
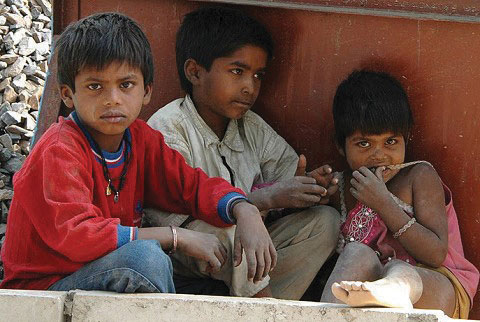
Poor nations have higher birth rates for several reasons. One reason is the agricultural economies typical of these nations. In these economies, children are an important economic resource, and families will ordinarily try to have as many children as possible.
Wikimedia Commons – public domain.
Mortality and Death Rates
Mortality is the flip side of fertility and refers to the number of deaths. Demographers measure it with the crude death rate, the number of deaths for every 1,000 people in a population in a given year. We call this a “crude” death rate because the population component consists of the total population and does not take its age distribution into account. All things equal, a society with a higher proportion of older people should have a higher crude death rate. Demographers often calculate age-adjusted death rates that adjust for a population’s age distribution.
Migration
Another important demographic concept is migration, the movement of people into and out of specific regions. Since the dawn of human history, people have migrated in search of a better life, and many have been forced to migrate by ethnic conflict or the slave trade.
Several classifications of migration exist. When people move into a region, we call it in-migration, or immigration; when they move out of a region, we call it out-migration, or emigration. The in-migration rate is the number of people moving into a region for every 1,000 people in the region, while the out-migration rate is the number of people moving from the region for every 1,000 people. The difference between the two is the net migration rate (in-migration minus out-migration). Recalling our earlier discussion. Michigan has had a net migration of less than zero, as its out-migration has exceeded its in-migration.
Migration can also be either domestic or international in scope. Domestic migration happens within a country’s national borders, as when retired people from the northeastern United States move to Florida or the Southwest. International migration happens across national borders. When international immigration is heavy, the effect on population growth and other aspects of national life can be significant, as can increased prejudice against the new immigrants. Domestic migration can also have a large impact. The great migration of African Americans from the South into northern cities during the first half of the twentieth century changed many aspects of those cities’ lives (Wilkerson, 2011). Meanwhile, the movement during the past few decades of northerners into the South and Southwest also had quite an impact: The housing market initially exploded, for example, and traffic increased.
Population Growth and Decline
Now that you are familiar with some basic demographic concepts, we can discuss population change in more detail. Three of the factors just discussed determine changes in population size: fertility (crude birth rate), mortality (crude death rate), and net migration. The natural growth rate is simply the difference between the crude birth rate and the crude death rate. The US natural growth rate is about 0.6 percent (or 6 per 1,000 people) per year. When immigration is also taken into account, the total population growth rate has been almost 1.0 percent per year (Rosenberg, 2012).
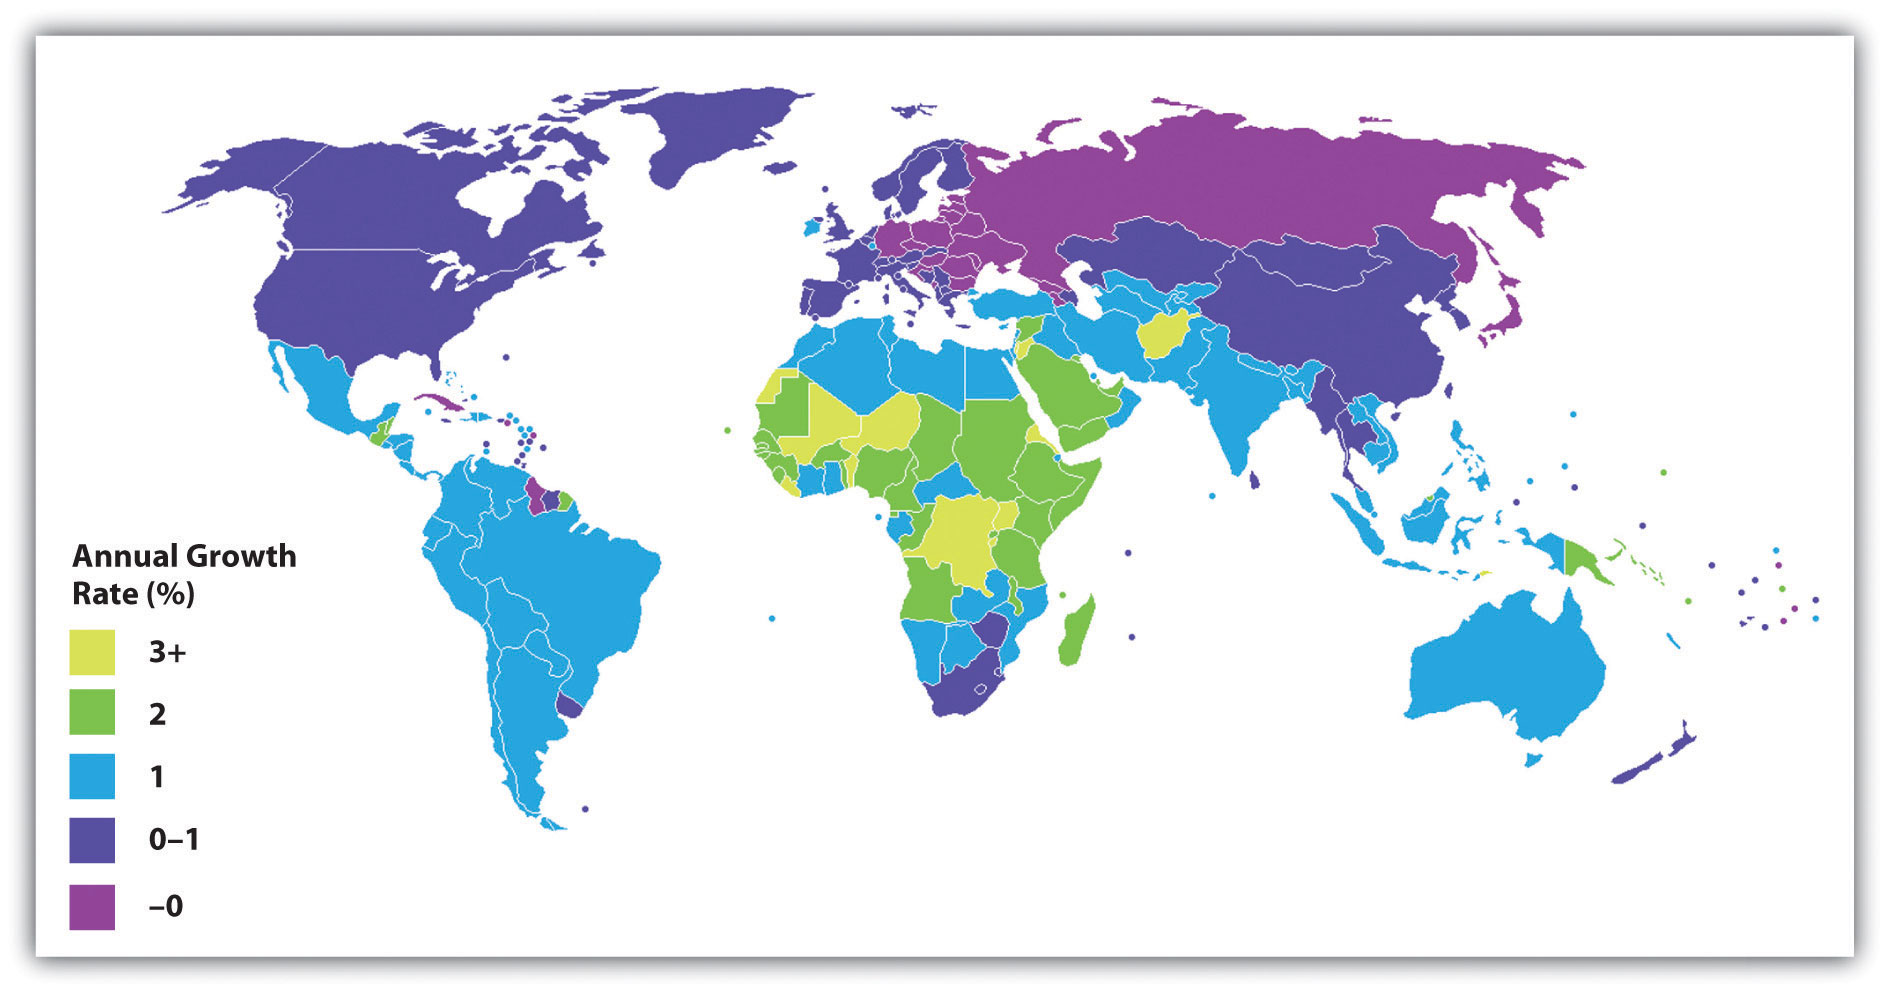
Figure 15.3 “International Annual Population Growth Rates (%), 2005–2010” depicts the annual population growth rate (including both natural growth and net migration) of all the nations in the world. Note that many African nations are growing by at least 3 percent per year or more, while most European nations are growing by much less than 1 percent or are even losing population, as discussed earlier. Overall, the world population is growing by about 80 million people annually (Population Reference Bureau, 2012).
Figure 15.3 International Annual Population Growth Rates (%), 2005–2010
Source: Adapted from http://lt.wikipedia.org/wiki/Vaizdas:Population_growth_rate_world_2005-2010_UN.PNG.
To determine how long it takes for a nation to double its population size, divide the number 70 by its population growth rate. For example, if a nation has an annual growth rate of 3 percent, it takes about 23.3 years (70 ÷ 3) for that nation’s population size to double. As you can see from the map in Figure 15.3 “International Annual Population Growth Rates (%), 2005–2010”, several nations will see their population size double in this time span if their annual growth continues at its present rate. For these nations, population growth will be a serious problem if food and other resources are not adequately distributed.
Demographers use their knowledge of fertility, mortality, and migration trends to make projections about population growth and decline several decades into the future. Coupled with our knowledge of past population sizes, these projections allow us to understand population trends over many generations. One clear pattern emerges from the study of population growth. When a society is small, population growth is slow because there are relatively few adults to procreate. But as the number of people grows over time, so does the number of adults. More and more procreation thus occurs every single generation, and population growth then soars in a virtual explosion.
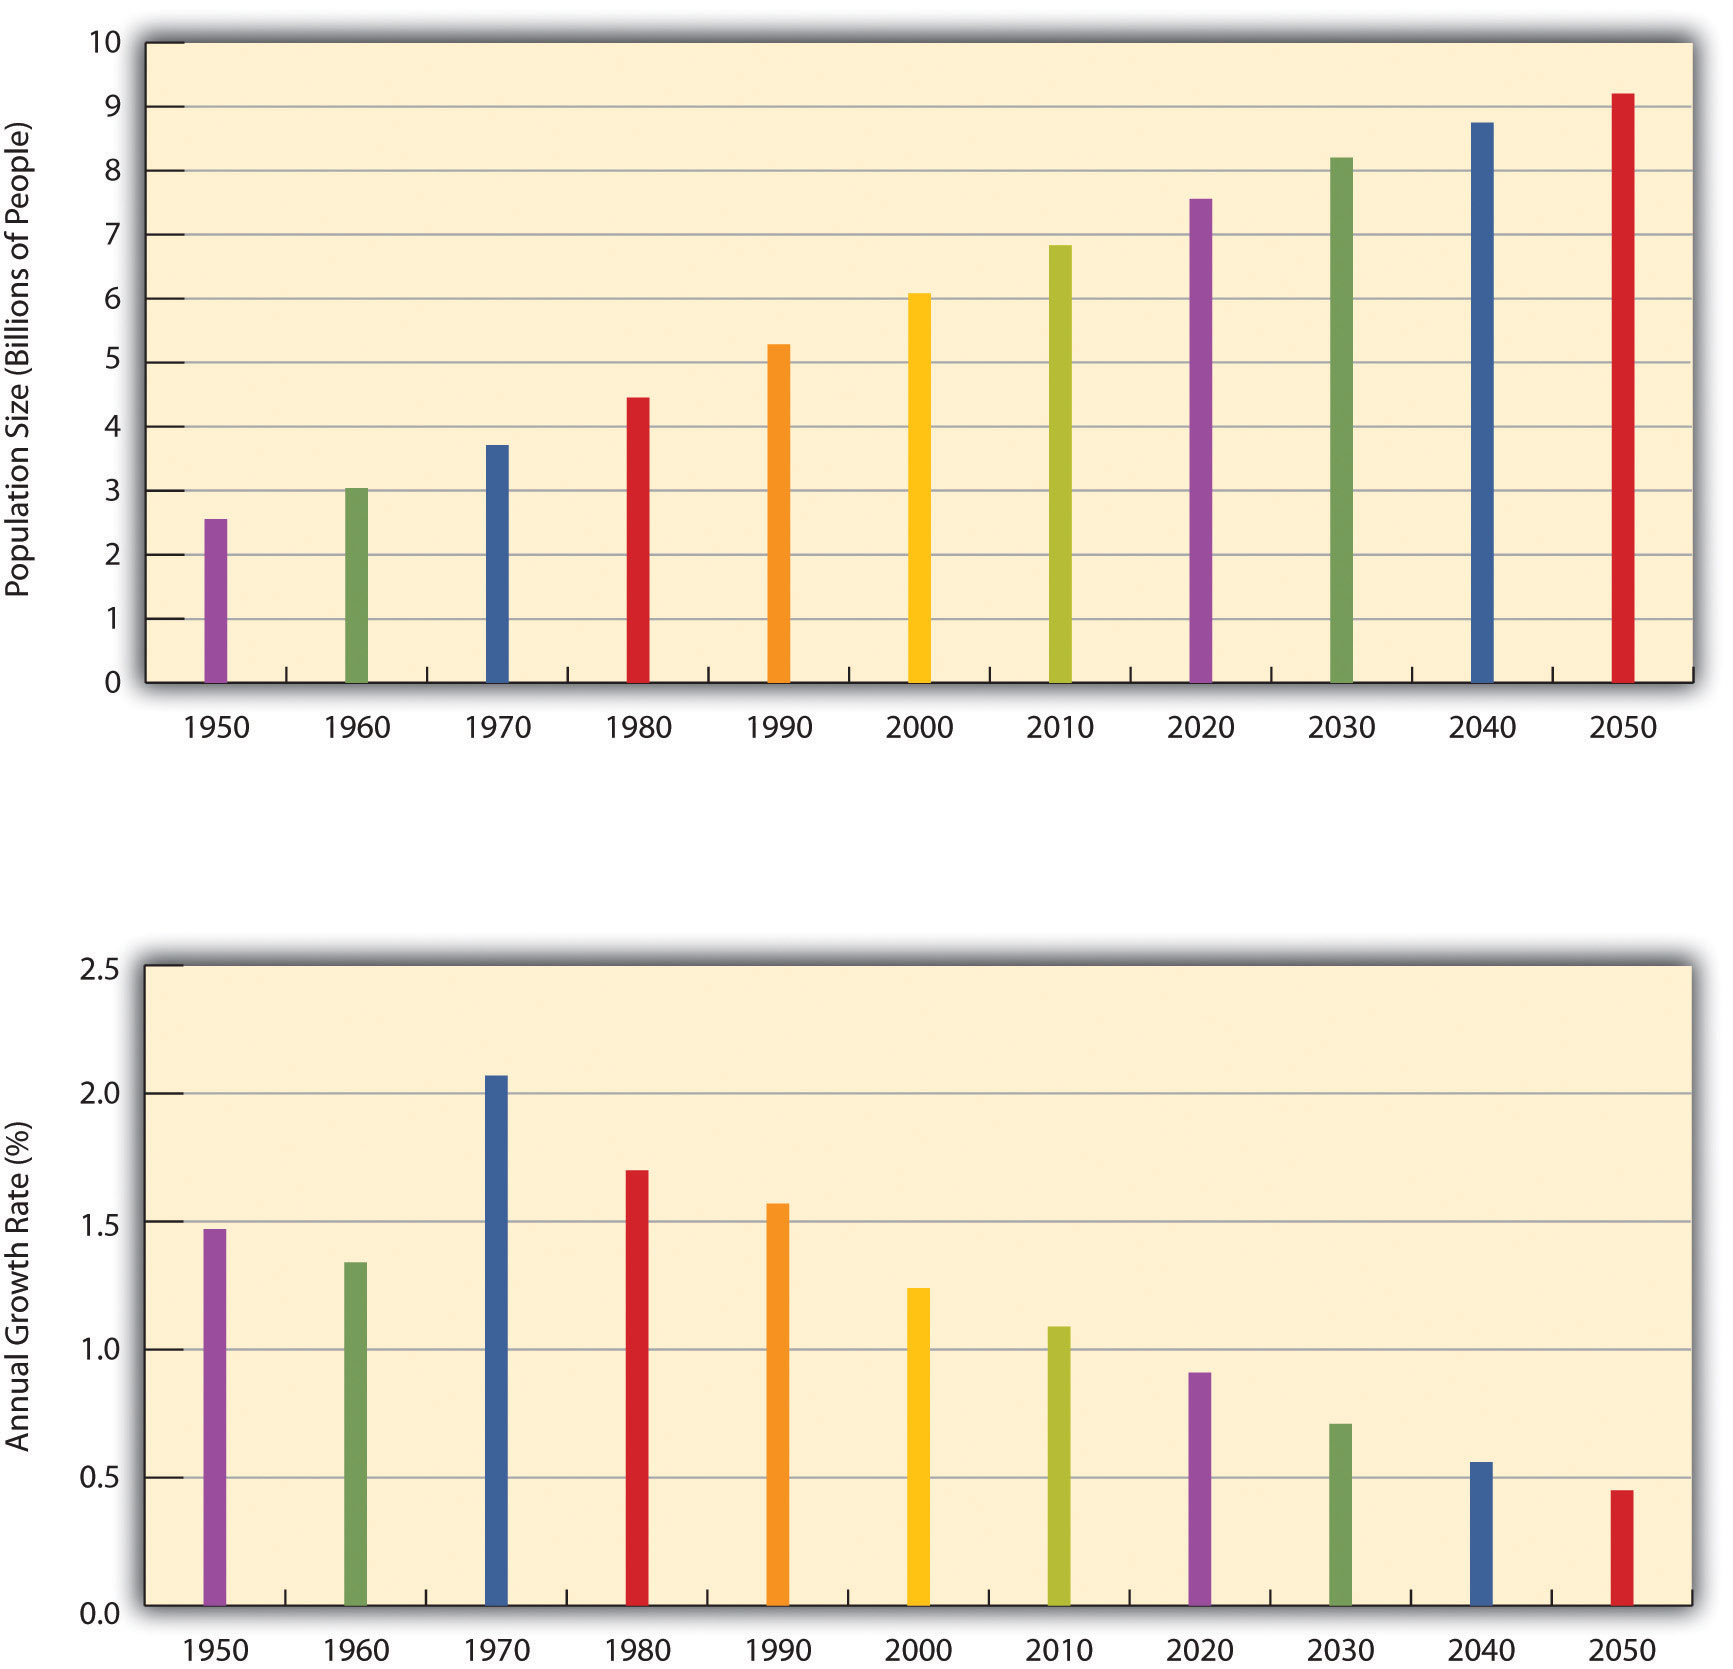
We saw evidence of this pattern when we looked at world population growth. When agricultural societies developed some 12,000 years ago, only about 8 million people occupied the planet. This number had reached about 300 million about 2,100 years ago, and by the fifteenth century it was still only about 500 million. It finally reached 1 billion by about 1850; by 1950, only a century later, it had doubled to 2 billion. Just fifty years later, it tripled to more than 6.8 billion, and it is projected to reach more than 9 billion by 2050 (see Figure 15.4 “Total World Population, 1950–2050”) and 10 billion by 2100 (Gillis & Dugger, 2011).
Figure 15.4 Total World Population, 1950–2050
Source: Data from US Census Bureau. (2012). Statistical abstract of the United States: 2012. Washington, DC: US Government Printing Office. Retrieved from http://www.census.gov/compendia/statab.
Eventually, however, population growth begins to level off after exploding, as explained by demographic transition theory, discussed later. We see this in the bottom half of Figure 15.4 “Total World Population, 1950–2050”, which shows the average annual growth rate for the world’s population. This rate has declined over the last few decades and is projected to further decline over the next four decades. This means that while the world’s population will continue to grow during the foreseeable future, it will grow by a smaller rate as time goes by. As Figure 15.3 “International Annual Population Growth Rates (%), 2005–2010” suggested, the growth that does occur will be concentrated in the poor nations in Africa and some other parts of the world. Still, even in these nations the average number of children a woman has in her lifetime dropped from six a generation ago to about three today.
Past and projected sizes of the US population appear in Figure 15.5 “Past and Projected Size of the US Population, 1950–2050 (in Millions)”. The US population is expected to number about 440 million people by 2050.
Figure 15.5 Past and Projected Size of the US Population, 1950–2050 (in Millions)

Source: Data from US Census Bureau. (2012). Statistical abstract of the United States: 2012. Washington, DC: US Government Printing Office. Retrieved from http://www.census.gov/compendia/statab.
Views of Population Growth

Thomas Malthus, an English economist who lived about two hundred years ago, wrote that population increases geometrically while food production increases only arithmetically. These understandings led him to predict mass starvation.
Wikimedia Commons – public domain.
The numbers just discussed show that the size of the United States and world populations has increased tremendously in just a few centuries. Not surprisingly, people during this time have worried about population growth and specifically overpopulation. One of the first to warn about population growth was Thomas Malthus (1766–1834), an English economist, who said that population increases geometrically (2, 4, 8, 16, 32, 64, 128, 256, 512, 1024…). If you expand this list of numbers, you will see that they soon become overwhelmingly large in just a few more “generations.” Malthus (1798/1926) said that food production increases only arithmetically (1, 2, 3, 4, 5, 6…) and thus could not hope to keep up with the population increase, and he predicted that mass starvation would be the dire result.
During the 1970s, population growth became a major issue in the United States and some other nations. Zero population growth, or ZPG, was a slogan often heard. There was much concern over the rapidly growing population in the United States and, especially, around the world, and there was fear that our “small planet” could not support massive increases in the number of people (Ehrlich, 1969). Some of the most dire predictions of the time warned of serious food shortages by the end of the century.
Fortunately, Malthus and ZPG advocates were wrong to some degree. Although population levels have certainly soared, the projections in Figure 15.4 “Total World Population, 1950–2050” show the rate of increase is slowing. Among other factors, the development of more effective contraception, especially the birth control pill, has limited population growth in the industrial world and, increasingly, in poorer nations. Food production has also increased by a much greater amount than Malthus and ZPG advocates predicted.
The Debate over Overpopulation
Many experts continue to be concerned about overpopulation, as they feel it is directly responsible for the hunger and malnutrition that plague hundreds of millions of people in poor nations (Gillis, 2011). One expert expressed this concern: “Every billion more people makes life more difficult for everybody—it’s as simple as that. Is it the end of the world? No. Can we feed 10 billion people? Probably. But we obviously would be better off with a smaller population” (Gillis & Dugger, 2011, p. A1). Recognizing this problem, India has begun giving cash bonuses to poor, rural married couples, who typically have high fertility rates, to wait to have children, and it has intensified its encouragement of contraception (Yardley, 2010).

Calls during the 1970s for zero population growth (ZPG) population control stemmed from concern that the planet was becoming overpopulated and that food and other resources would soon be too meager to support the world’s population.
James Cridland – Crowd – CC BY 2.0.
However, other experts say the world’s resources remain sufficient and minimize the problem of overpopulation. They acknowledge that widespread hunger in Africa and other regions does exist. However, they attribute this problem not to overpopulation and lack of food but rather to problems in distributing the sufficient amount of food that does in fact exist. As an official for Oxfam International explained, “Today’s major problems in the food system are not fundamentally about supply keeping up with demand, but more about how food gets from fields and on to forks” (2011). The official added that enough grain (cereal and soy) exists to easily feed the world, but that one-third of cereal and 90 percent of soy feed livestock instead. Moving away from a meat-laden Western diet would thus make much more grain available for the world’s hungry poor.
Sociologists Stephen J. Scanlan and colleagues add that food scarcity results from inequalities in food distribution rather than from overpopulation: “[Food] scarcity is largely a myth. On a per capita basis, food is more plentiful today than any other time in human history…Even in times of localized production shortfalls or regional famines there has long been a global food surplus…A good deal of thinking and research in sociology…suggests that world hunger has less to do with the shortage of food than with a shortage of affordable or accessible food. Sociologists have found that social inequalities, distribution systems, and other economic and political factors create barriers to food access” (Scanlan, Jenkins, & Peterson, 2010, p. 35).
This sociological view has important implications for how the world should try to reduce global hunger. International organizations such as the World Bank and several United Nations agencies have long believed that hunger is due to food scarcity, and this belief underlies the typical approaches to reducing world hunger that focus on increasing food supplies with new technologies and developing more efficient methods of delivering food. But if food scarcity is not a problem, then other approaches are necessary. According to Scanlan et al., these approaches involve reducing the social inequalities that limit poor nations’ access to food.
As an example of one such inequality, Scanlan et al. point out that poor nations lack the funds to import the abundant food that does exist. These nations’ poverty, then, is one inequality that leads to world hunger, but gender and ethnic inequalities are also responsible. Nations with higher rates of gender inequality and ethnic inequality have higher rates of hunger. In view of this fact, the authors emphasize that improvements in gender and ethnic equality are necessary to reduce global hunger: “International attention to food security should therefore shift from increasing food supply to regulating armed conflict, improving human rights, and promoting gender equity throughout the world—factors that reduce barriers to access and empower populations throughout the world to benefit from their food entitlements” (Scanlan et al., 2010, p. 39).
Demographic Transition Theory
As we consider whether overpopulation is the threat that Malthus and contemporary concerned scientists have considered it to be, it is important to appreciate demographic transition theory, mentioned earlier. This theory links population growth to the level of technological development across three stages of social evolution and suggests that this growth slows considerably as nations become more industrialized.
In the first stage, coinciding with preindustrial societies, the birth rate and death rate are both high. The birth rate is high because of the lack of contraception and the several other reasons cited earlier for high fertility rates, and the death rate is high because of disease, poor nutrition, lack of modern medicine, and other problems. These two high rates cancel each other out, and little population growth occurs.
In the second stage, coinciding with the development of industrial societies, the birth rate remains fairly high, owing to the lack of contraception and a continuing belief in the value of large families, but the death rate drops because of several factors, including increased food production, better sanitation, and improved medicine. Because the birth rate remains high but the death rate drops, population growth takes off dramatically.
In the third stage, the death rate remains low, but the birth rate finally drops as families begin to realize that large numbers of children in an industrial economy are more of a burden than an asset. Another reason for the drop is the availability of effective contraception. As a result, population growth slows, and, as we saw earlier, it has become quite low or even gone into a decline in several industrial nations.
Demographic transition theory, then, gives us more reason to be cautiously optimistic regarding the threat of overpopulation: As poor nations continue to modernize—much as industrial nations did two hundred years ago—their population growth rates should start to decline.
Still, population growth rates in poor nations continue to be high, and, as already mentioned, gender and ethnic inequality helps allow rampant hunger to persist. Hundreds of thousands of women die in poor nations each year during pregnancy and childbirth. Reduced fertility would save their lives, in part because their bodies would be healthier if their pregnancies were spaced farther apart (Schultz, 2008). Although world population growth is slowing, then, it is still growing too rapidly in poor nations. To reduce it further, more extensive family planning programs are needed, as is economic development in general: Women who are better educated and have more money tend to have lower fertility.
Population Decline and Pronatalism

Spain is one of several European nations that have been experiencing a population decline because of lower birth rates. Like some other nations, Spain has adopted pronatalist policies to encourage people to have more children; it provides €2,500, about $3,400, for each child.
paul.hartrick – Spain-477 – CC BY-NC 2.0.
If population growth remains a problem in poor nations, population decline is a problem in some industrial nations. As noted earlier, some nations are even experiencing population declines, while several more are projected to have population declines by 2050 (Brooks, 2012). For a country to maintain its population, the average woman needs to have 2.1 children, the replacement level for population stability. But several industrial nations, not including the United States, are below this level. Increased birth control is one reason for their lower fertility rates but so are decisions by women to stay in school longer, to go to work right after their schooling ends, and to postpone having their first child.
Ironically, these nations’ population declines have begun to concern demographers and policymakers (Haartsen & Venhorst, 2010). Because people in many industrial nations are living longer while the birth rate drops, these nations are increasingly having a greater proportion of older people and a smaller proportion of younger people. In several European nations, there are more people 61 or older than 19 or younger. As this trend continues, it will become increasingly difficult to take care of the health and income needs of so many older persons, and there may be too few younger people to fill the many jobs and provide the many services that an industrial society demands. The smaller labor force may also mean that governments will have fewer income tax dollars to provide these services.
To deal with these problems, several governments have initiated pronatalist policies aimed at encouraging women to have more children. In particular, they provide generous child-care subsidies, tax incentives, and flexible work schedules designed to make it easier to bear and raise children, and some even provide couples outright cash payments when they have an additional child. Russia in some cases provides the equivalent of about $9,000 for each child beyond the first, while Spain provides €2,500 (equivalent to about $3,400) for each child (Haub, 2009).
Two Other Problems Related to Population Growth
As we saw, population experts debate the degree to which population growth contributes to global poverty and hunger. But there is little debate that population growth contributes to two other global problems.

Population growth causes many environmental problems, one of which is deforestation.
crustmania – Deforestation – CC BY 2.0.
One of these problems concerns the environment. Population growth in both wealthy and poor nations has damaged the environment in many ways (Walsh, 2011). As the news story that opens this chapter illustrated, countries with large numbers of people drive many motor vehicles that pollute the air, and these countries engage in many other practices of the industrial era that pollute the air, water, and ground. Further, as populations have expanded over the centuries, they have cut down many trees and deforested many regions across the globe. This deforestation ruins animal habitats and helps to contribute to global warming because trees help remove carbon dioxide from the atmosphere and release oxygen into the atmosphere.
Another problem is interpersonal conflict in general and armed conflict in particular. As populations grow, they need more and more food, water, and other resources. When these resources have become too scarce over the centuries, many societies have decided to take resources from other societies “by any means necessary,” as the old saying goes, meaning the use of force (Gleditsch & Theisen, 2010).
Population growth thus helps to create armed conflict between societies, but it also helps to generate conflict within a single society. As a society grows, people begin to compete for resources. This competition has often led to hostility of many types, including interpersonal violence. As we shall discuss shortly, the history of immigration in the United States illustrates this dynamic. As the number of immigrants grew rapidly in various historical eras, native-born whites perceived threats to their jobs, land, and other resources and responded with mob violence.
Immigration
Recall that migration generally and immigration specifically are central concepts in the study of population. As just indicated, immigration is also a source of great controversy in the United States and in many other countries. This controversy is perhaps almost inevitable, as increasing numbers of immigrants can affect many aspects of a society: crowding in its cities, increasing enrollments in its schools, having enough jobs for everyone who wants to work, and so forth. However, the fact that immigration can cause these complications does not begin to justify the prejudice and hostility that have routinely greeted immigrants into the United States and elsewhere.
The history of the United States is filled with prejudice and hostility of this type. Starting with the Pilgrims, this nation was settled by immigrants who came to these shores seeking political and religious freedom and economic opportunity. Despite these origins, when great waves of immigrants came to the United States beginning in the nineteenth century, they were hardly greeted with open arms (Roediger, 2006). During the first half of this century, some 3 million Irish immigrants, most of them Catholic, moved to the United States. Because these immigrants were not Anglo-Saxon Protestants, native-born whites (most of whom were Anglo-Saxon Protestants) deeply disliked them and even considered them to be a different race from white. During the 1850s, the so-called Know-Nothing Party, composed of native-born whites, was openly hostile to Irish immigrants and would engage in mob violence against them, with many murders occurring. Later waves of immigrants from Italian, Polish, and Jewish backgrounds also were not considered fully white and subject to employment discrimination and other ethnic prejudice and hostility.
Beginning with the California gold rush of 1849 and continuing after the Civil War, great numbers of Chinese immigrants came to the United States and helped to build the nation’s railroads and performed other important roles. They, too, were greeted hostilely by native-born whites who feared the Chinese were taking away their jobs (Pfaelzer, 2008). As the national economy worsened during the 1870s, riots against the Chinese occurred in western cities. In more than three hundred cities and towns, whites went into Chinese neighborhoods, burned them down, and murdered some Chinese residents while forcing the remainder to leave town. Congress finally outlawed Chinese immigration in 1882, with this ban lasting for almost a century.
During the 1930s, rising numbers of Mexican Americans in the western United States led to similar hostility (Daniels, 2002). The fact that this decade was the time of the Great Depression deepened whites’ concerns that Mexican immigrants were taking away their jobs. White-owned newspapers falsely claimed that these immigrants posed a violent threat to white Americans, and that their supposed violence was made more likely by their use of marijuana. It is estimated that at least 500,000 Mexicans returned to their native country, either because they were forcibly deported or because they returned there themselves under great pressure.
Immigration Today
Immigration continues to be a major concern for many Americans today, whose concern centers mostly on Mexican immigrants even though they are less than a majority of all immigrants. According to political scientist Victoria M. DeFrancesco Soto (2012), this focus stems from racial prejudice: “Let’s call a spade a spade. Opposition to immigration is not a concern rooted in personal economic concerns. Neither is it a concern having to do with state’s rights. Anti-immigrant sentiment isn’t even about immigrants as a whole. As rigorous social scientific research shows, opposition to immigration is closely linked to the negative racial animus toward one very specific group, Latinos.”
As we try to make sense of immigration and of immigration policy, some basic facts are worth appreciating. The number of immigrants greatly increased two or three decades ago, but the number of illegal immigrants entering the United States now is very small compared to just a decade ago (Myers, 2012). Foreign-born residents composed 12.9 percent of the US population in 2010, or 40 million immigrants overall, compared to only 7.9 percent in 1990 (Immigration Policy Center, 2012). Almost one-third of immigrants are Mexican, while one-fourth are Asian. Most of the remainder come from the Caribbean, Central America, and South America. Slightly more than half of all foreign-born residents come from Mexico or one of the other Latin American nations. Almost 40 percent of Latinos and two-thirds of Asians in the United States are foreign-born.
Almost three-fourths of immigrants are naturalized US citizens, legal residents, or legal temporary migrants. Slightly more than one-fourth, 28 percent, or about 11 million people, are illegal residents. About 60 percent, or almost 7 million, of these residents are Mexican. Approximately 4.5 million children born in the United States, who are thus citizens, have at least one parent who is an unauthorized immigrant.
Unauthorized immigrants compose more than 5 percent of the US labor force, a number equivalent to 8 million workers. Households headed by unauthorized immigrants paid an estimated $11.2 billion in state and federal taxes in 2010. According to the Immigration Policy Center (2012), if all unauthorized immigrants somehow left the United States, the US economy would suffer an annual loss of 2.8 million jobs, $552 billion in economic activity, and $245 billion in gross domestic product (GDP).
As these labor and economic figures make clear, illegal immigrants form an important component of the US economy. In another fact that may surprise immigration opponents, many studies also find that immigrants, both legal and illegal, have lower crime rates than nonimmigrants (Wadsworth, 2010). These low rates are thought to stem from immigrants’ stable families, strong churches, and high numbers of small businesses that make for stable neighborhoods. Ironically, as immigrants stay longer in the United States, the crime rates of their children, and then those of their children’s children, become higher. As immigrant families stay longer in the United States, then, their crime rates tend to rise, in part because they become “Americanized” (Sampson, 2008).
Efforts to Limit Immigration
Although immigrants strengthen the US economy and have low crime rates, much of the public is opposed to immigration. In the 2010 General Social Survey (GSS), half the respondents said that the number of immigrants to the United States should be reduced by “a little” or “a lot,” and only about 14 percent said this number should be increased. In a 2011 CNN poll, one-third of the public said it is “somewhat” or “very” unsympathetic toward illegal immigrants and their families. In the same poll, more than half the public favored building a seven-hundred-mile fence along the border with Mexico (PollingReport.com, 2012).
In recent years, many states enacted strict laws regarding immigrants, including the denial of schooling and various social services to unauthorized immigrant families. Arizona, Georgia, and Alabama enacted some of the most restrictive legislation.

Arizona is one of several states that have enacted very restrictive laws regarding immigration.
Nevele Osteog – Immigration Reform Leaders Arrested in Washington DC – CC BY 2.0.
Arizona’s law, passed in 2010, made failing to carry immigration documents a crime and required the police to question and detain anyone they suspected of being an illegal immigrant. Previously, these restrictions had been the sole province of the federal government. Critics charged this new law would lead to ethnic and racial profiling, as only people who looked Mexican would be stopped by police for suspicion of being illegal (Archibold, 2010). They also noted that the new law caused an economic loss of $250 million during the first year after its enactment from a loss in conference and convention business in Arizona (Brown, 2011).
Georgia’s law, enacted in 2011, allowed police to demand immigration documents from criminal suspects and to hold suspects who do not provide documentation for deportation by federal officials. The law also made it more difficult to hire workers without proper documentation, increased the penalties for businesses that hire these workers, and provided penalties for people who house or transport unauthorized immigrants. Georgia’s Chamber of Commerce worried about the law’s economic impact, and in particular was concerned that the law would reduce tourism. Reports estimated that if the law forced all unauthorized workers to leave Georgia, the state’s agricultural industry would lose up to $1 billion annually, since unauthorized workers form the bulk of the Georgia’s farm labor force (Berman, 2011).
Alabama’s law, enacted in 2011, also allowed police to detain people suspected of being unauthorized immigrants. In addition, it required schools to record the immigration status of all students and also required people seeking a driver’s license to prove that they were US citizens. The law led to very long lines to renew driver’s licenses, and, because immigrant migrant workers left the state, many crops went unharvested on the state’s farms. Business leaders feared the law would harm the state’s economy, a fear that was heightened when a German executive at Mercedes-Benz was detained by police (Ott, 2012).
Several months after the Alabama law took effect, a study by a University of Alabama economist concluded that it had forced at least 40,000 and perhaps as many as 80,000 unauthorized workers to leave the state (Lee, 2012). The exit of so many workers caused an estimated annual loss to Alabama’s GDP of at least $2 billion, a loss in state and state revenue from income and sales taxes of at least $57 million, and a loss in local sales tax revenue of at least $20 million.
Self-Deportation
Many critics of immigration hope these and other laws and practices will make life so difficult for unauthorized immigrants that they engage in self-deportation by returning to Mexico or their other native countries. According to the Immigration Policy Center (2012), however, there is little evidence that self-deportation actually occurs. A major reason for this fact is that two-thirds of unauthorized adult immigrants have been in the United States for at least ten years, and almost half are parents of children born in the United States (who, as mentioned earlier, are thus US citizens). These adults and their children therefore have established roots in American soil and simply want to stay in the United States.
Detention
The federal government has the responsibility for detaining and deporting unauthorized immigrants. The number of immigrants detained every year exceeds 360,000, with an average detention length of almost three months; more than 1,000 individuals are detained for over a year. At a cost of more than $60,000 per detainee, the annual cost of this detention system exceeds $21 billion. Most detainees are in custody for technical violations of immigrant laws, such as overstaying a visa, rather than for serious criminal behavior. As such, they do not pose a public danger.
Debate continues over the extent to which the government should carry out deportation, but critics and even immigration judges decry the conditions under which illegal immigrants are detained (Semple, 2011). They say that detainees are denied basic due process rights, such as the right to have a court-appointed attorney. More than four-fifths have no legal representation at all, and those who do receive legal assistance often receive incompetent assistance.
Immigrants and Domestic Violence
Another immigration issue concerns battered women who are immigrants (Constable, 2012). When women are beaten or otherwise abused by their husbands or boyfriends, it is often difficult for them to leave their abusers (see Chapter 10 “The Changing Family”). But abused immigrant women face a special problem in this regard. Because often they are allowed to live in the United States only because their husbands are legal residents or citizens, they fear deportation if they go to the police and their husband is deported. Other abused immigrant women who are in the United States illegally similarly fear they will be deported if they go to the police. Fortunately, federal law now allows abused immigrant women to apply for legal residency, but many women are not aware of this possibility.
Although our discussion of immigration has painted a critical portrait of many aspects of US immigration policy, the United States actually ranks fairly high among the world’s nations in how it treats its immigrants. The Note 15.17 “Lessons from Other Societies” box discusses this international comparison in greater detail.
Lessons from Other Societies
The Status of Legal Immigrants in Western Democracies
The Migrant Integration Policy Index (MIPEX) is an effort of the British Council and the Migration Policy Group, an international consortium. This index ranks the United States, Canada, and twenty-eight European nations on the extent to which legal immigrants are integrated into each nation’s political and economic life and on the path to full citizenship. It also ranks the extent to which each nation has antidiscrimination laws to protect immigrants. Overall, MIPEX consists of 148 policy indicators.
In the latest (2011) MIPEX report, the United States ranked ninth out of the thirty-one states on this index; Sweden ranked first, followed by Portugal and Canada. Summarizing one of the effort’s major findings, a news report observed that “strong U.S. antidiscrimination laws protect immigrants and guarantee them equal rights and opportunities, a model for immigration rules elsewhere.” MIPEX also ranked the United States highly on legal immigrants’ opportunities for employment, for education, and for reuniting with family members.
At the same time, the MIPEX report noted that the United States denies many immigrants several federal benefits and imposes large fees for certain immigration procedures. It also asserted that US immigration laws are unnecessarily complex and that visa availability is too limited. The relatively lower scores that the United States enjoyed in all these areas led it to lag behind the eight nations that scored higher on the index.
Reacting to the MIPEX report, the director of the Immigration Policy Center in Washington, DC, said the United States would benefit from improving its efforts to integrate immigrants, for example by better helping them learn English, and she warned that federal and state budget cuts threatened to lower the US ranking.
Although the United States, then, ranks fairly high among the world’s democracies in the status of its legal immigrants, the higher status enjoyed by immigrants in Canada and some other democracies points to directions the United States should follow to improve its ranking and create a better climate for its immigrants.
Sources: Huddleston & Niessen, 2011; Restrepo, 2011
Key Takeaways
- To understand changes in the size and composition of population, demographers use several concepts, including fertility and birth rates, mortality and death rates, and migration.
- Although overpopulation remains a serious concern, many experts say the world’s food supply is sufficient providing that it is distributed efficiently and equitably.
- Although illegal immigration to the United States has dwindled and immigrants are faring well overall, many Americans are concerned about immigration, and several states have passed very restrictive laws concerning immigration.
For Your Review
- How concerned are you about population growth and overpopulation? Explain your answer in a brief essay.
- Before you began reading this chapter, did you think that food scarcity was the major reason for world hunger today? Why do you think a belief in food scarcity is so common among Americans?
- Do you think nations with low birth rates should provide incentives for women to have more babies? Why or why not?
- If immigrants seem to be faring fairly well in the United States, as the text explains, why do you think so many Americans have negative attitudes about immigration and immigrants? Explain your answer.
References
Archibold, R. C. (2010, April 24). Arizona enacts stringent law on immigration. New York Times, p. A1.
Berman, J. (2011, November 28). Georgia immigration law could have dire consequences for state’s economy: Study. The Huffington Post. Retrieved from http://www.huffingtonpost.com/2011/2010/2005/georgia-immigration-law-economy_n_995889.html.
Brooks, D. (2012, March 13). The population implosion. New York Times, p. A25.
Brown, R. (2011, May 14). Georgia gives police added power to seek out illegal immigrants. New York Times, p. A12.
Constable, P. (2012, February 8). For battered immigrant women, fear of deportation becomes abusers’ weapon, but 2 laws can overcome that. The Washington Post. Retrieved from http://www.washingtonpost.com/local/for-battered-immigrant-women-fear-of-deportation-becomes-abusers-weapon/2012/01/30/gIQAZCx3zQ_story.html.
Daniels, R. (2002). Coming to America: A history of immigration and ethnicity in American life. New York, NY: Harper Perennial.
DeFrancesco Soto, V. M. (2012, February 24). Anti-immigrant rhetoric is anti-Latino. The Nation. Retrieved from http://www.thenation.com/blog/166442/anti-immigrant-rhetoric-anti-latino.
Dzwonkowski, R. (2010, September 19). New leaders can’t shrink from Michigan realities. Detroit Free Press, p. 2A.
Ehrlich, P. R. (1969). The population bomb. San Francisco, CA: Sierra Club.
Gillis, J. (2011, June 5). A warm planet struggles to feed itself. New York Times, p. A1.
Gillis, J., & Dugger, C. W. (2011, May 4). UN forecasts 10.1 million by century’s end. New York Times, p. A1.
Gleditsch, N. P., & Theisen, O. M. (2010). Resources, the environment and conflict. In M. D. Cavelty & V. Mauer (Eds.), The Routledge handbook of security studies (pp. 221–232). New York, NY: Routledge.
Haartsen, T., & Venhorst, V. (2010). Planning for decline: Anticipating on population decline in the Netherlands. Tijdschrift voor Economische en Sociale Geografie (Journal of Economic & Social Geography), 101(2), 218–227.
Hamilton, B. E., Martin, J. A., & Ventura, S. J. (2011). Births: Preliminary data for 2010. National Vital Statistics Reports, 60(2), 1–14.
Haub, C. (2009). Birth rates rising in some low birth-rate countries. Washington, DC: Population Reference Bureau. Retrieved from http://www.prb.org/Articles/2009/fallingbirthrates.aspx.
Huddleston, T., & Niessen, J. (2011). Migrant integration policy index III. Brussels, Belgium: British Council and Migration Policy Group.
Immigration Policy Center. (2012). Strength in diversity: The economic and political power of immigrants, Latinos, and Asians. Washington, DC: Author.
Immigration Policy Center. (2012). The real meaning of “self-deportation.” Washington, DC: Author.
King, R. (2011, June 1). Global food crisis: The challenge of changing diets. The Guardian. Retrieved from http://www.guardian.co.uk/global-development/poverty-matters/2011/jun/01/global-food-crisis-changing-diets.
Lee, M. J. (2012, February 1). Alabama immigration law costs $11 billion, study shows. Politico. Retrieved from http://www.politico.com/news/stories/0212/72308.html.
Malthus, T. R. (1926). First essay on population. London, United Kingdom: Macmillan. (Oringal work published 1798).
Myers, D. (2012, January 12). The next immigration challenge. New York Times, p. A27.
Ott, T. (2012, February 7). Alabama’s immigration law may get a second look. National Public Radio. Retrived from http://www.npr.org/2012/2002/2007/146490508/alabamas-immigration-law-may-get-a-second-look.
Pfaelzer, J. (2008). Driven out: The forgotten war against Chinese Americans. Berkeley, CA: University of California Press.
PollingReport.com. (2012). Immigration. Retrieved February 8, 2012, from http://www.pollingreport.com/immigration.htm.
Population Reference Bureau. (2012). World population growth, 1950–2050. Retrieved February 4, 2012, from http://www.prb.org/Educators/TeachersGuides/HumanPopulation/PopulationGrowth.aspx.
Restrepo, M. (2011, March 1). International study points out US immigration policy successes, failures. The American Independent. Retrieved from http://www.americanindependent.com/171724/international-study-points-out-u-s-immigration-policy-successes-failures.
Roediger, D. R. (2006). Working toward whiteness: How America’s immigrants became white. New York, NY: Basic Books.
Rosenberg, M. (2012). Population growth rates. Retrieved from http://geography.about.com/od/populationgeography/a/populationgrow.htm.
Sampson, R. J. (2008). Rethinking crime and immigration. Contexts, 7(2), 28–33.
Scanlan, S. J., Jenkins, J. C., & Peterson, L. (2010). The scarcity fallacy. Contexts, 9(1), 34–39.
Semple, K. (2011, December 19). In a study, judges express a bleak view of lawyers representing immigrants. New York Times, p. A24.
Sutton, P. D., & Hamilton, B. E. (2011). Recent trends in births and fertility rates through 2010. Washington, DC: Centers for Disease Control and Prevention.
Wadsworth, T. (2010). Is immigration responsible for the crime drop? An assessment of the influence of immigration on changes in violent crime between 1990 and 2000. Social Science Quarterly, 91, 531–553.
Walsh, B. (2011, October 26). Why the real victim of overpopulation will be the environment. Time. Retrieved from http://www.time.com/time/specials/packages/article/0,28804,2097720_2097782_2097814,00.html.
Weeks, J. R. (2012). Population: An introduction to concepts and issues (11th ed.). Belmont, CA: Wadsworth.
Wilkerson, I. (2011). The warmth of other suns: The epic story of America’s great migration New York, NY: Vintage Books.
Yardley, J. (2010, August 22). India tries using cash bonuses to slow birthrates. New York Times, p. A8.
