4.3 Dimensions of Gender Inequality
Learning Objectives
- Summarize the status of women around the world today.
- Understand the extent of and reasons for gender inequality in income and the workplace in the United States.
- Understand the extent of and reasons for sexual harassment.
The primary focus of this chapter is gender inequality in the United States, but it is also important to discuss gender inequality worldwide. While American women are unequal to men in many respects, women’s situation throughout much of the world is especially dire. Accordingly, we first examine the global inequality of women before turning our attention to the United States.
The Global Inequality of Women
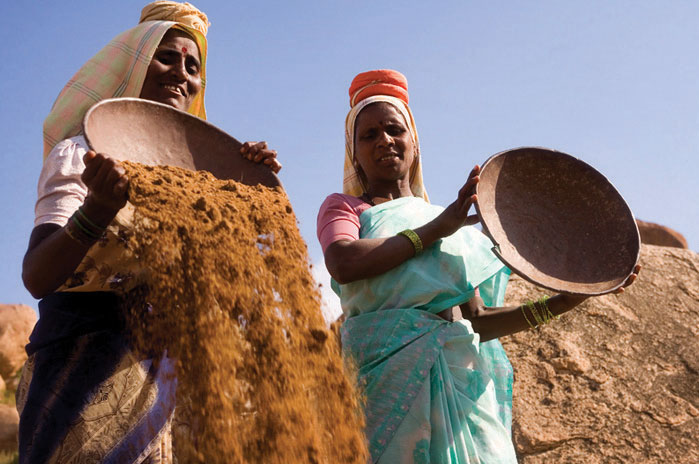
The problem of global poverty first discussed in Chapter 2 “Poverty” is especially severe for women. Although, as Chapter 2 “Poverty” noted, more than 1.4 billion people on earth are desperately poor, their ranks include more than their fair share of women, who are estimated to make up 70 percent of the world’s poor. Because women tend to be poorer than men worldwide, they are more likely than men to experience all the problems that poverty causes, including malnutrition and disease. But they also suffer additional problems. Some of these problems derive from women’s physiological role of childbearing, and some arise from how they are treated simply because they are women.
Let’s first look at childbearing. One of the most depressing examples of how global poverty affects women is maternal mortality, or the number of women who die during childbirth for every 100,000 live births. More than 500,000 women die worldwide annually from complications during pregnancy or childbirth. Maternal mortality usually results from one or more of the following: inadequate prenatal nutrition, disease and illness, and inferior obstetrical care, all of which are much more common in poor nations than in wealthy nations. In wealthy nations, the rate of maternal mortality is 14 per 100,000 births, but in poor nations the rate is a distressingly high 590 per 100,000 births, equivalent to almost 6 deaths for every 1,000 births. Women in poor nations are thus forty-two times more likely than those in wealthy nations to die from complications during pregnancy or childbirth (World Bank, 2012).
In India and Pakistan, thousands of new wives every year are murdered in dowry deaths because they have not provided their husbands a suitable amount of money and goods.
Wikimedia Commons – CC BY 2.0.
In addition to these problems, women in poor nations fare worse than men in other ways because of how they are treated as women. One manifestation of this fact is the violence they experience (World Health Organization, 2010).World Health Organization/London School of Hygiene and Tropical Medicine. (2010). Preventing intimate partner and sexual violence against women: Taking action and generating evidence. Geneva, Switzerland: Author. About one-third of women worldwide have been raped or beaten, leading Amnesty International (2004) to call violence against women “the greatest human rights scandal of our times.” Although violence against women certainly occurs in wealthy nations, it is more common and extreme in poor and middle-income nations, and in nations where women’s inequality (as reflected by criteria such as their labor force participation and their educational attainment) is especially high (Kaya & Cook, 2010). More than half of women in Uganda, for example, have been physically or sexually abused (Amnesty International, 2010). Many young women in India who work outside the home have been raped by male high-school dropouts who think these women lack virtue and should be punished with rape (Polgreen, 2011). In India and Pakistan, thousands of women are killed every year in dowry deaths, in which a new wife is murdered by her husband and/or his relatives if she does not pay the groom money or goods (Kethineni & Srinivasan, 2009). In many countries, young girls routinely have their genitals cut out, often with no anesthesia, in what has been termed female genital mutilation, a practice that is thought to affect more than 100 million girls and women across the earth and has been called an act of torture (Kristoff, 2011; Rogo, Subayi, & Toubia, 2007).
Sex trafficking is another major problem in countries like Cambodia, India, Nepal, and Thailand, where young girls are often stolen from their parents and forced to work as prostitutes in what amounts to sexual slavery. The number of girls (and sometimes boys) under age 18 who work as sex slaves is thought to reach into the millions and to be larger than the number of African slaves during the eighteenth and nineteenth centuries (Kristoff & WuDunn, 2010).
Beyond violence, women in poor nations are less likely than their male counterparts to get a higher education, and girls are less likely than boys to attend primary school. Women are also less likely than men to work in jobs that pay a decent wage and to hold political office. In many poor nations, girls are less likely than boys to receive adequate medical care when they become ill and are more likely than boys to die before age 5. In all these ways, women and girls in poor nations especially suffer.
In stark contrast, women in wealthy democratic nations fare much better than their counterparts in poor nations. In many wealthy democracies, women’s status vis-à-vis men is higher than in the United States. The Note 4.23 “Lessons from Other Societies” box discusses this situation further.
Lessons from Other Societies
Women in the Nordic Nations
The United Nations Development Programme ranks nations on a “gender empowerment measure” of women’s involvement in their nation’s economy and political life (United Nations Development Programme, 2009). Of the 109 nations included in the measure, Sweden ranks first, followed by Norway, Finland, and Denmark. The remaining Nordic nation, Iceland, ranks eighth. The other nations in the top ten are the Netherlands, Belgium, Australia, Germany, and New Zealand. Canada ranks twelfth, and the United States ranks only eighteenth. In trying to understand why the United States ranks this low and what it might be able to do to increase its empowerment of women, the experience of the Nordic nations provides some important lessons.
The Nordic nations rank at the top of the gender empowerment measure largely because they have made a concerted effort to boost women’s involvement in the business and political worlds (Sumer, Smithson, Guerreiro, & Granlund, 2008). They are all social democratic welfare states characterized by extensive government programs and other efforts to promote full economic and gender equality.
For example, Norway’s government provides day care for children and adult care for older or disabled individuals, and it also provides forty-four weeks of paid parental leave after the birth of a child. Parents can also work fewer hours without losing income until their child is 2 years of age. All these provisions mean that women are much more likely than their American counterparts to have the freedom and economic means to work outside the home, and they have taken advantage of this opportunity. As a recent analysis concluded, “It has been extremely important for women that social rights have been extended to cover such things as the caring of young children and elderly, sick and disabled members of society. In the Nordic countries, women have been more successful than elsewhere in combining their dual role as mothers and workers, and social policy arrangements are an integral part of the gender equality policy” (Kangas & Palme, 2009, p. 565).
The lesson for the United States is clear: An important reason for the Nordic nations’ high gender empowerment ranking is government policy that enables women to work outside the home if they want to do so. The experience of these nations indicates that greater gender equality might be achieved in the United States if it adopted policies similar to those found in these nations that make it easier for women to join and stay in the labor force.
Gender Inequality in the United States
We have said that the women’s movement changed American life in many ways but that gender inequality persists in the United States. Let’s look at examples of such inequality, much of it taking the form of institutional discrimination, which, as we saw in Chapter 3 “Racial and Ethnic Inequality”, can occur even if it is not intended to happen. We start with gender inequality in income and the workplace and then move on to a few other spheres of life.
The Gender Gap in Income
In the last few decades, women have entered the workplace in increasing numbers, partly, and for many women mostly, out of economic necessity, and partly out of desire for the sense of self-worth and other fulfillment that comes with work. In February 2012, 57.9 percent of US women aged 16 or older were in the labor force, compared to only 43.3 percent in 1970; comparable figures for men were 70.3 percent in 2012 and 79.7 percent in 1970 (Bureau of Labor Statistics, 2012). Thus while women’s labor force participation continues to lag behind men’s, this gender gap has narrowed. The figures just cited include women of retirement age. When we just look at younger women, labor force participation is even higher. For example, 74.7 percent of women aged 35–44 were in the labor force in 2011, compared to only 46.8 percent in 1970.
Despite the workplace gains women have made, problems persist. Perhaps the major problem is a gender gap in income. Women have earned less money than men ever since records started being kept (Reskin & Padavic, 2002). In the United States in the early 1800s, full-time women workers in agriculture and manufacturing earned less than 38 percent of what men earned. By 1885, they were earning about 50 percent of what men earned in manufacturing jobs. As the 1980s began, full-time women workers’ median weekly earnings were about 65 percent of men’s. Women have narrowed the gender gap in earnings since then: Their weekly earnings now (2011) are 82.2 percent of men’s among full-time workers ages 16 and older (Bureau of Labor Statistics, 2012). Still, this means that for every $10,000 men earn, women earn only about $8,220. To turn that around, for every $10,000 women earn, men earn $12,156. This gap amounts to hundreds of thousands of dollars over a lifetime of working.

Women have earned less money than men ever since records started being kept. Women now earn about 81 percent of what men earn.
John Jacobi – receptionist answering phone at suburban eye care – CC BY 2.0.
As Table 4.1 “Median Annual Earnings of Full-Time, Year-Round Workers Aged 25–64 by Educational Attainment, 2010*” shows, this gender gap exists for all levels of education and even increases with higher levels of education. On the average, women with a bachelor’s degree or higher and working full time earn almost $18,000 less per year than their male counterparts.
Table 4.1 Median Annual Earnings of Full-Time, Year-Round Workers Aged 25–64 by Educational Attainment, 2010*
| High school dropout | High school degree | Some college or associate’s degree | Bachelor’s degree or higher | |
|---|---|---|---|---|
| Men | 25,272 | 36,920 | 43,940 | 69,160 |
| Women | 20,176 | 28,236 | 33,176 | 51,272 |
| Difference | 5,096 | 8,684 | 10,764 | 17,888 |
| Gender gap (%; women ÷ men) | 79.8 | 76.5 | 75.5 | 74.1 |
| * Median weekly earnings × 52 weeks | ||||
Source: US Department of Labor. (2011). Highlights of women’s earnings in 2010. Washington, DC: Author.
What accounts for the gender gap in earnings? A major reason is sex segregation in the workplace, which accounts for up to 45 percent of the gender gap (Kelley, 2011; Reskin & Padavic, 2002). Although women have increased their labor force participation, the workplace remains segregated by gender. Almost half of all women work in a few low-paying clerical and service (e.g., waitressing) jobs, while men work in a much greater variety of jobs, including high-paying ones. Table 4.2 “Gender Segregation in the Workplace for Selected Occupations, 2010” shows that many jobs are composed primarily of women or of men. Part of the reason for this segregation is that socialization affects what jobs young men and women choose to pursue, and part of the reason is that women and men do not want to encounter difficulties they may experience if they took a job traditionally assigned to the other sex. A third reason is that sex-segregated jobs discriminate against applicants who are not the “right” sex for that job. Employers may either consciously refuse to hire someone who is the “wrong” sex for the job or have job requirements (e.g., height requirements) and workplace rules (e.g., working at night) that unintentionally make it more difficult for women to qualify for certain jobs. Although such practices and requirements are now illegal, they still continue. The sex segregation they help create contributes to the continuing gender gap between female and male workers. Occupations dominated by women tend to have lower wages and salaries. Because women are concentrated in low-paying jobs, their earnings are much lower than men’s (Reskin & Padavic, 2002).
This fact raises an important question: Why do women’s jobs pay less than men’s jobs? Is it because their jobs are not important and require few skills (recalling the functional theory of stratification discussed in Chapter 2 “Poverty”)? The evidence indicates otherwise: Women’s work is devalued precisely because it is women’s work, and women’s jobs thus pay less than men’s jobs because they are women’s jobs (Magnusson, 2009).
Table 4.2 Gender Segregation in the Workplace for Selected Occupations, 2010
| Occupation | Female workers (%) | Male workers (%) |
|---|---|---|
| Preschool and kindergarten teachers | 97.0 | 3.0 |
| Speech-language pathologists | 96.3 | 3.7 |
| Secretaries and administrative assistants | 96.1 | 3.9 |
| Dental hygienists | 95.1 | 4.9 |
| Registered nurses | 91.1 | 8.9 |
| Food servers (waiters/waitresses) | 71.1 | 29.9 |
| Pharmacists | 53.0 | 47.0 |
| Physicians | 32.3 | 67.7 |
| Lawyers | 31.5 | 68.5 |
| Dentists | 25.5 | 64.5 |
| Computer software engineers | 20.9 | 79.1 |
| Electricians | 1.5 | 98.5 |
| Carpenters | 1.4 | 98.5 |
Source: Data from US Census Bureau. (2012). Statistical abstract of the United States: 2012. Washington, DC: US Government Printing Office. Retrieved from http://www.census.gov/compendia/statab.
Studies of comparable worth support this argument (Levanon, England, & Allison, 2009). Researchers rate various jobs in terms of their requirements and attributes that logically should affect the salaries they offer: the importance of the job, the degree of skill it requires, the level of responsibility it requires, the degree to which the employee must exercise independent judgment, and so forth. They then use these dimensions to determine what salary a job should offer. Some jobs might be better on some dimensions and worse on others but still end up with the same predicted salary if everything evens out.

Some women’s jobs pay less than men’s jobs even though their comparable worth is equal to or even higher than the men’s jobs. For example, a social worker, depicted here, may earn less money than a probation officer, even though calculations based on comparable worth would predict that a social worker should earn at least as much.
Wikimedia Commons – CC BY 2.0.
When researchers make their calculations, they find that certain women’s jobs pay less than men’s even though their comparable worth is equal to or even higher than the men’s jobs. For example, a social worker may earn less money than a probation officer, even though calculations based on comparable worth would predict that a social worker should earn at least as much. The comparable worth research demonstrates that women’s jobs pay less than men’s jobs of comparable worth and that the average working family would earn several thousand dollars more annually if pay scales were reevaluated based on comparable worth and women were paid more for their work.
Even when women and men work in the same jobs, women often earn less than men, and men are more likely than women to hold leadership positions in these occupations. Government data provide ready evidence of the lower incomes women receive even in the same occupations. For example, among full-time employees, female marketing and sales managers earn only 66 percent of what their male counterparts earn; female human resource managers earn only 80 percent of what their male counterparts earn; female claims adjusters earn only 77 percent; female accountants earn only 75 percent; female elementary and middle school teachers earn only 91 percent; and even female secretaries and clerical workers earn only 91 percent (US Department of Labor, 2011).
One reason for these differences, and for women’s lower earnings in general, is their caregiving responsibilities (Chang, 2010). Women are more likely than men to have the major, and perhaps the sole, responsibility for taking care of children and aging parents or other adults who need care. This responsibility limits their work hours and often prompts them to drop out of the labor force. If women rejoin the labor force after their children start school, or join for the first time, they are already several years behind men who began working at an earlier age. Economics writer David Leonhardt (2010, p. B1) explains this dynamic: “Many more women take time off from work. Many more women work part time at some point in their careers. Many more women can’t get to work early or stay late. And our economy exacts a terribly steep price for any time away from work—in both pay and promotions. People often cannot just pick up where they have left off. Entire career paths are closed off. The hit to earnings is permanent.”
We can see evidence of this “hit” when we examine the gender gap in earnings by age. This gap is relatively low for people in their early twenties, when women earn 93.8 percent of what men earn, but rises during the next two decades of age as more and more women bear and raise children (see Figure 4.4 “Gender, Age, and Median Weekly Earnings of Full-Time Employees, 2010”).
Figure 4.4 Gender, Age, and Median Weekly Earnings of Full-Time Employees, 2010
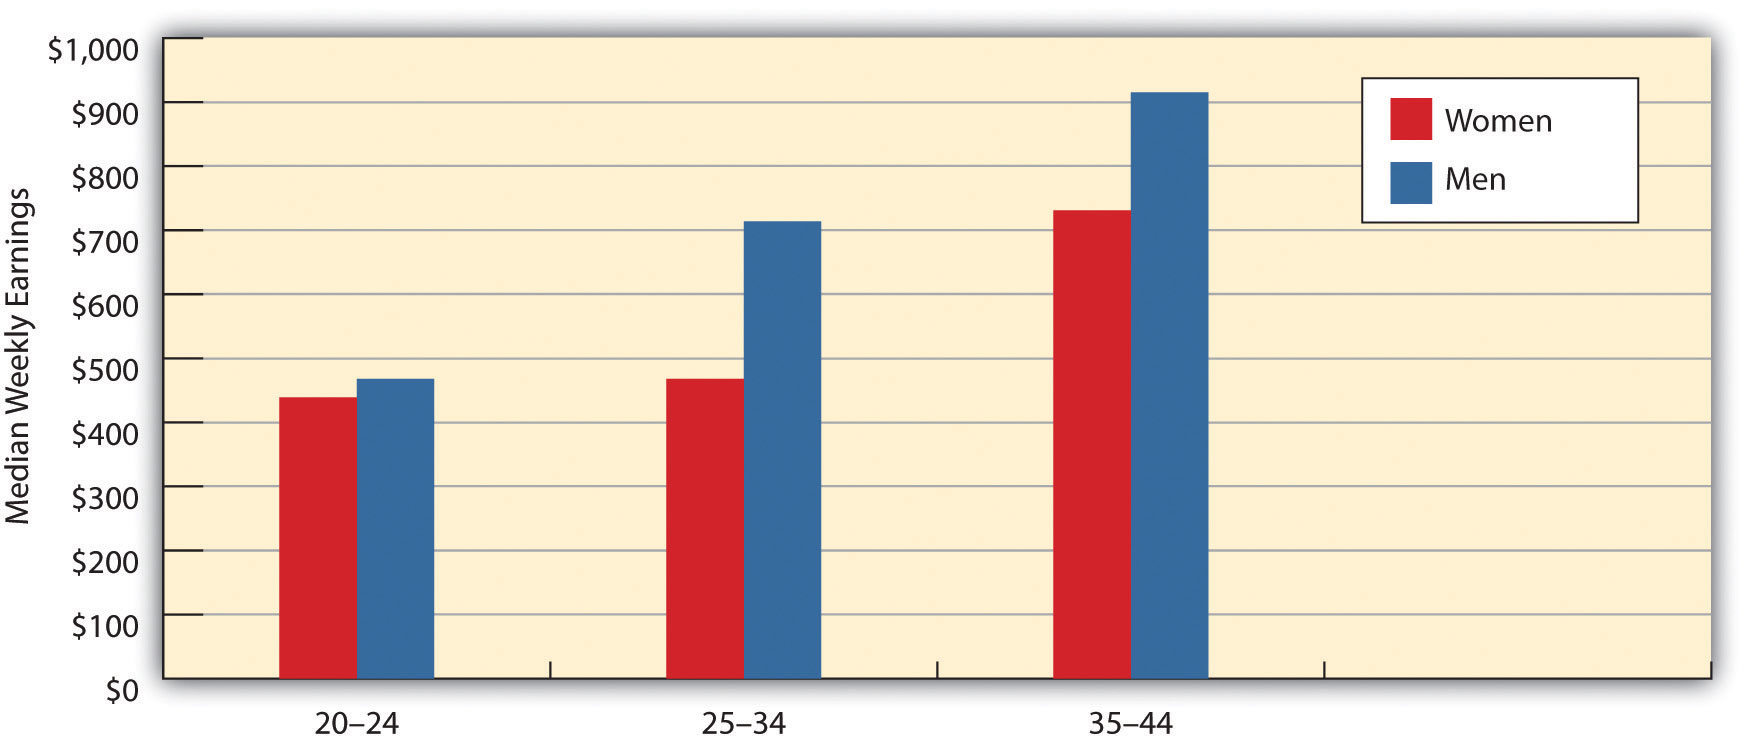
Source: U.S. Department of Labor. (2011). Highlights of Women’s Earnings in 2010. Washington, DC: U.S. Department of Labor.
Still, when variables like number of years on the job, number of hours worked per week, and size of firm are taken into account, gender differences in earnings diminish but do not disappear altogether, and it is very likely that sex discrimination (conscious or unconscious) by employers accounts for much of the remaining disparity.
Some of the sex discrimination in employment reflects the existence of two related phenomena, the glass ceiling and the glass escalator. Women may be promoted in a job only to find they reach an invisible “glass ceiling” beyond which they cannot get promoted, or they may not get promoted in the first place. In the largest US corporations, women constitute only about 16 percent of the top executives, and women executives are paid much less than their male counterparts (Jenner & Ferguson, 2009). Although these disparities stem partly from the fact that women joined the corporate ranks much more recently than men, they also reflect a glass ceiling in the corporate world that prevents qualified women from rising up above a certain level (Hymowitz, 2009). Men, on the other hand, can often ride a “glass escalator” to the top, even in female occupations. An example is seen in elementary school teaching, where principals typically rise from the ranks of teachers. Although men constitute only about 16 percent of all public elementary school teachers, they account for about 41 percent of all elementary school principals (Aud et al., 2011).

Women constitute only about 16 percent of the top executives in the largest US corporations, and women executives are paid much less than their male counterparts. These disparities reflect a “glass ceiling” that limits women’s opportunities for promotion.
Baltic Development Forum – Kristovskis meeting – CC BY 2.0.
Whatever the reasons for the gender gap in income, the fact that women make so much less than men means that female-headed families are especially likely to be poor. In 2010, almost 32 percent of these families lived in poverty, compared to only 6 percent of married-couple families (DeNavas-Walt, Proctor, & Smith, 2011). As noted in Chapter 2 “Poverty”, the term feminization of poverty refers to the fact that female-headed households are especially likely to be poor. The gendering of poverty in this manner is one of the most significant manifestations of gender inequality in the United States.
Sexual Harassment
Another workplace problem (including schools) is sexual harassment, which, as defined by federal guidelines and legal rulings and statutes, consists of unwelcome sexual advances, requests for sexual favors, or physical conduct of a sexual nature that is used as a condition of employment or promotion or that interferes with an individual’s job performance and creates an intimidating or hostile environment.
Although men can be, and are, sexually harassed, women are more often the targets of sexual harassment. This gender difference exists for at least two reasons, one cultural and one structural. The cultural reason centers on the depiction of women and the socialization of men. As our discussion of the mass media and gender socialization indicated, women are still depicted in our culture as sexual objects that exist for men’s pleasure. At the same time, our culture socializes men to be sexually assertive. These two cultural beliefs combine to make men believe that they have the right to make verbal and physical advances to women in the workplace. When these advances fall into the guidelines listed here, they become sexual harassment.

Sexual harassment in the workplace is a common experience. In surveys of women employees, up to two-thirds of respondents report having been sexually harassed.
Wikimedia Commons – CC BY-SA 4.0.
The second reason that most targets of sexual harassment are women is more structural. Reflecting the gendered nature of the workplace and of the educational system, typically the men doing the harassment are in a position of power over the women they harass. A male boss harasses a female employee, or a male professor harasses a female student or employee. These men realize that subordinate women may find it difficult to resist their advances for fear of reprisals: A female employee may be fired or not promoted, and a female student may receive a bad grade.
How common is sexual harassment? This is difficult to determine, as the men who do the sexual harassment are not about to shout it from the rooftops, and the women who suffer it often keep quiet because of the repercussions just listed. But anonymous surveys of women employees in corporate and other settings commonly find that 40–65 percent of the respondents report being sexually harassed (Rospenda, Richman, & Shannon, 2009). In a survey of 4,501 women physicians, 36.9 percent reported being sexually harassed either in medical school or in their practice as physicians (Frank, Brogan, & Schiffman, 1998). In studies of college students, almost one-third of women undergraduates and about 40 percent of women graduate students report being sexually harassed by a faculty member (Clodfelter, Turner, Hartman, & Kuhns, 2010).
Studies of people who have been sexually harassed find that they often experience various psychological problems. The Note 4.29 “Applying Social Research” box discusses this body of research further.
Applying Social Research
The Long-Term Mental Health Consequences of Sexual Harassment
Despite the fact that sexual harassment is illegal, most women (and men) who are sexually harassed do not bring court action. Two reasons explain their decision not to sue: they fear being fired and/or they worry they will not be believed. But another reason has to do with the mental and emotional consequences of being sexually harassed. These consequences include relationship problems, a loss of self-esteem, fatigue, depression, anxiety, sleeplessness, and a feeling of powerlessness. These effects are similar to those for posttraumatic stress disorder and are considered symptoms of what has been termed sexual harassment trauma syndrome. This syndrome, and perhaps especially the feeling of powerlessness, are thought to help explain why sexual harassment victims hardly ever bring court action and otherwise often keep quiet. According to law professor Theresa Beiner, the legal system should become more aware of these psychological consequences as it deals with the important question in sexual harassment cases of whether harassment actually occurred. If a woman keeps quiet about the harassment, it is too easy for judges and juries to believe, as happens in rape cases, that the woman originally did not mind the behavior that she now says is harassment.
Should the legal system begin to make better use of social science research on sexual harassment trauma syndrome, a recent study by sociologist Jason N. Houle and colleagues provides important new evidence for legal officials to consider. The authors note two faults in prior sexual harassment research. First, most studies have focused on workers in a single occupation, such as lawyers, or in a single organization, such as a university campus, rather than in a diverse set of occupations and organizations. Second, because most studies have examined workers at only one point in time, they have been unable to study the long-term psychological consequences of sexual harassment.
To correct these deficiencies, Houle et al. analyzed data from a study of 1,010 ninth-graders in St. Paul, Minnesota, that followed them from 1988 to 2004, when they were 30 or 31 years old. The study included measures of the respondents’ experience of sexual harassment at several periods over the study’s sixteen-year time span (ages 14–18, 19–26, 29–30, and 30–31), their level of psychological depression, and their sociodemographic background. Focusing on depression at ages 30 or 31, the authors found that sexual harassment at ages 14–18 did not affect the chances of depression at ages 30–31, but that sexual harassment during any of the other three age periods did increase the chances of depression at ages 30–31. These results held true for both women and men who had been harassed. The authors concluded that the “effects of harassment are indeed lasting, as harassment experiences early in the career were associated with heightened depressive symptoms nearly 10 years later.”
In finding long-term effects of sexual harassment on women and men in a variety of occupations and organizational settings, Houle et al.’s study made an important contribution to our understanding of the psychological consequences of sexual harassment. Its findings underscore the need for workplaces and campuses to do everything possible to eliminate this illegal and harmful behavior and perhaps will prove useful in sexual harassment lawsuits.
Sources: Beiner, 2005; Houle, Staff, Mortimer, Uggen, & Blackstone, 2011; Willness, Steel, & Lee, 2007
Women of Color: A Triple Burden
Earlier we mentioned multicultural feminism, which stresses that women of color face difficulties for three reasons: their gender, their race, and, often, their social class, which is frequently near the bottom of the socioeconomic ladder. They thus face a triple burden that manifests itself in many ways.
For example, women of color experience extra income inequality. Earlier we discussed the gender gap in earnings, with women earning 82.2 percent of what men earn, but women of color face both a gender gap and a racial/ethnic gap. Table 4.3 “The Race/Ethnicity and Gender Gap in Annual Earnings for Full-Time, Year-Round Workers, 2010*” depicts this double gap for full-time workers. We see a racial/ethnic gap among both women and men, as African Americans and Latinos of either gender earn less than whites. We also see a gender gap between men and women, as women earn less than men within any race/ethnicity. These two gaps combine to produce an especially high gap between African American and Latina women and white men: African American women earn only about 70 percent of what white men earn, and Latina women earn only about 60 percent of what white men earn.
Table 4.3 The Race/Ethnicity and Gender Gap in Annual Earnings for Full-Time, Year-Round Workers, 2010*
| Annual earnings ($) | Percentage of white male earnings | |
|---|---|---|
| Men | ||
| White (non-Hispanic) | 44,200 | — |
| Black | 32,916 | 74.5 |
| Latino | 26,416 | 59.8 |
| Women | ||
| White (non-Hispanic) | 35,568 | 80.5 |
| Black | 30,784 | 69.7 |
| Latina | 26,416 | 59.8 |
| * Median weekly earnings × 52 weeks | ||
Source: US Department of Labor. (2011). Highlights of women’s earnings in 2010. Washington, DC: Author.
These differences in income mean that African American and Latina women are poorer than white women. We noted earlier that almost 32 percent of all female-headed families are poor. This figure masks race/ethnic differences among such families: 24.8 percent of families headed by non-Latina white women are poor, compared to 41.0 percent of families headed by African American women and also 44.5 percent of families headed by Latina women (DeNavas-Walt et al., 2011). While white women are poorer than white men, African American and Latina women are clearly poorer than white women.
Household Inequality
Gender inequality occurs within families and households. We will talk more about this aspect of family life in Chapter 10 “The Changing Family”, but briefly discuss here one significant dimension of gender-based household inequality: housework. Someone has to do housework, and that someone is usually a woman. It takes many hours a week to clean the bathrooms, cook, shop in the grocery store, vacuum, and do everything else that needs to be done. The research evidence indicates that women married to or living with men spend two to three times as many hours per week on housework as men spend (Gupta & Ash, 2008). This disparity holds true even when women work outside the home, leading sociologist Arlie Hochschild (Hochschild, 1989) to observe in a widely cited book that women engage in a “second shift” of unpaid work when they come home from their paying job.
The good news is that gender differences in housework time are smaller than a generation ago. The bad news is that a large gender difference remains. As one study summarized the evidence on this issue, “Women invest significantly more hours in household labor than do men despite the narrowing of gender differences in recent years” (Bianchi, Milkie, Sayer, & Robinson, 2000, p. 196). In the realm of household work, then, gender inequality persists.
Key Takeaways
- Among full-time workers, women earn about 79.4 percent of men’s earnings. This gender gap in earnings stems from several factors, including sex segregation in the workplace and the lower wages and salaries found in occupations that involve mostly women.
- Sexual harassment results partly from women’s subordinate status in the workplace and may involve up to two-thirds of women employees.
- Women of color may face a “triple burden” of difficulties based on their gender, their race/ethnicity, and their social class.
For Your Review
- Do you think it is fair for occupations dominated by women to have lower wages and salaries than those dominated by men? Explain your answer.
- If you know a woman who works in a male-dominated occupation, interview her about any difficulties she might be experiencing as a result of being in this sort of situation.
References
Amnesty International. (2004). It’s in our hands: Stop violence against women. Summary. London, United Kingdom: Author.
Amnesty International. (2010). “I can’t afford justice”: Violence against women in Uganda continues unpunished and unchecked. London, United Kingdom: Author.
Aud, S., Hussar, W., Kena, G., Bianco, K., Frohlich, L., Kemp, J., & Tahan, K. (2011). The condition of education 2011 (NCES 2011-033). U.S. Department of Education, National Center for Education Statistics. Washington, DC: U.S. Government Printing Office. Retrieved from http://nces.ed.gov/pubs2011/2011033.pdf.
Beiner, T. (2005). Gender myths v. working realities: Using social science to reformulate sexual harassment law. New York, NY: New York University Press.
Bianchi, S. M., Milkie, M. A., Sayer, L. C., & Robinson, J. P. (2000). Is anyone doing the housework? Trends in the gender division of household labor. Social Forces, 79(1), 191–228.
Bureau of Labor Statistics. (2012). 2012 employment and earnings online. Washington, DC: Author. Retrieved from http://www.bls.gov/opub/ee/home.htm.
Chang, M. L. (2010). Shortchanged: Why women have less wealth and what can be done about it. New York, NY: Oxford University Press.
Clodfelter, T. A., Turner, M. G., Hartman, J. L., & Kuhns, J. B. (2010). Sexual harassment victimization during emerging adulthood. Crime & Delinquency, 56(3), 455–481.
DeNavas-Walt, C., Proctor, B. D., & Smith, J. C. (2011). Income, poverty, and health insurance coverage in the United States: 2010 (Current Population Reports, P60-239). Washington, DC: US Census Bureau.
Frank, E., Brogan, D., & Schiffman, M. (1998). Prevalence and correlates of harsssment among US women physicians. Archives of Internal Medicine, 158(4), 352–358.
Gupta, S., & Ash, M. (2008). Whose money, whose time? A nonparametric approach to modeling time spent on housework in the United States. Feminist Economics, 14(1), 93–120.
Hochschild, A. (1989). The second shift: Working parents and the revolution at home. New York, NY: Viking.
Houle, J. N., Staff, J., Mortimer, J. T., Uggen, C., & Blackstone, A. (2011). The impact of sexual harassment on depressive symptoms during the early occupational career. Society and Mental Health, 1, 89–105.
Hymowitz, C. (2009, May 1). For executive women, it can be lonely at the top. Forbes. Retrieved from http://www.forbes.com.
Jenner, L., & Ferguson, R. (2009). 2008 catalyst census of women corporate officers and top earners of the FP500. New York, NY: Catalyst.
Kangas, O., & Palme, J. (2009). Making social policy work for economic development: The Nordic experience. International Journal of Social Welfare, 18(s1), S62–S72.
Kaya, Y., & Cook, K. J. (2010). A cross-national analysis of physical intimate partner violence against women. International Journal of Comparative Sociology, 5, 423–444.
Kelley, L. (2011, April 12). Today is equal pay day: Women still earn 77 cents to a man’s dollar. AlterNet. Retrieved from http://www.alternet.org/rss/1/557442/today_is_equal_pay_day%557443A_women_still_earn_557477_cents_to_a_man %557445C’s_dollar/; Reskin, B., & Padavic, I. (2002). Women and men at work (2nd ed.). Thousand Oaks, CA: Pine Forge Press.
Kethineni, S., & Srinivasan, M. (2009). Police handling of domestic violence cases in Tamil Nadu, India. Journal of Contemporary Criminal Justice, 25, 202–213.
Kristoff, N. D. (2011, May 12). A rite of torture for girls. New York Times, p. A29.
Kristoff, N. D., & WuDunn, S. (2010). Half the sky: Turning oppression into opportunity for women worldwide. New York, NY: Vintage Books.
Leonhardt, D. (2010, August 4). A labor market punishing to mothers. New York Times, B1.
Levanon, A., England, P., & Allison, P. (2009). Occupational feminization and pay: Assessing causal dynamics using 1950–2000 US census data. Social Forces, 88(2), 865–891.
Magnusson, C. (2009). Gender, occupational prestige, and wages: A test of devaluation theory. European Sociological Review, 25(1), 87–101.
Polgreen, L. (2011, March 27). Rapes of women show clash of old and new India. New York Times, p. A8.
Reskin, B., & Padavic, I. (2002). Women and men at work (2nd ed.). Thousand Oaks, CA: Pine Forge Press.
Rogo, K., Subayi, T., & Toubia, N. (2007). Female genital cutting, women’s health and development: The role of the World Bank. Washington, DC: Africa Region Human Development Department.
Rospenda, K. M., Richman, J. A., & Shannon, C. A. (2009). Prevalence and mental health correlates of harassment and discrimination in the workplace: Results from a national study. Journal of Interpersonal Violence, 24(5), 819–843.
Sumer, S., Smithson, J., Guerreiro, M. D., & Granlund, L. (2008). Becoming working mothers: Reconciling work and family at three particular workplaces in Norway, the UK, and Portugal. Community, Work & Family, 11(4), 365–384.
United Nations Development Programme. (2009). Human development report 2009. New York, NY: Author.
US Department of Labor. (2011). Highlights of women’s earnings in 2010. Washington, DC: US Department of Labor.
Willness, C. R., Steel, P., & Lee, K. (2007). A meta-analysis of the antecedents and consequences of workplace sexual harassment. Personnel Psychology, 60, 127–162.
World Bank. (2012). Data. Retrieved from http://data.worldbank.org.
World Health Organization/London School of Hygiene and Tropical Medicine. (2010). Preventing intimate partner and sexual violence against women: Taking action and generating evidence. Geneva, Switzerland: Author.
