5.2 Responsiveness of Demand to Other Factors
Learning Objectives
- Explain the concept of income elasticity of demand and its calculation.
- Classify goods as normal or inferior depending on their income elasticity of demand.
- Explain the concept of cross price elasticity of demand and its calculation.
- Classify goods as substitutes or complements depending on their cross price elasticity of demand.
Although the response of quantity demanded to changes in price is the most widely used measure of elasticity, economists are interested in the response to changes in the demand shifters as well. Two of the most important measures show how demand responds to changes in income and to changes in the prices of related goods and services.
Income Elasticity of Demand
We saw in the chapter that introduced the model of demand and supply that the demand for a good or service is affected by income. We measure the income elasticity of demand, eY, as the percentage change in quantity demanded at a specific price divided by the percentage change in income that produced the demand change, all other things unchanged:
Equation 5.4
[latex]e_Y = \frac{ \% \: change \: in \: quantity \: demanded}{ \% \: change \: in \: income}[/latex]
The symbol Y is often used in economics to represent income. Because income elasticity of demand reports the responsiveness of quantity demanded to a change in income, all other things unchanged (including the price of the good), it reflects a shift in the demand curve at a given price. Remember that price elasticity of demand reflects movements along a demand curve in response to a change in price.
A positive income elasticity of demand means that income and demand move in the same direction—an increase in income increases demand, and a reduction in income reduces demand. As we learned, a good whose demand rises as income rises is called a normal good.
Studies show that most goods and services are normal, and thus their income elasticities are positive. Goods and services for which demand is likely to move in the same direction as income include housing, seafood, rock concerts, and medical services.
If a good or service is inferior, then an increase in income reduces demand for the good. That implies a negative income elasticity of demand. Goods and services for which the income elasticity of demand is likely to be negative include used clothing, beans, and urban public transit. For example, the studies we have already cited concerning the demands for urban public transit in France and in Madrid found the long-run income elasticities of demand to be negative (−0.23 in France and −0.25 in Madrid) (Bresson, G., et. al., 2004; Matas, A., 2004).
Figure 5.7
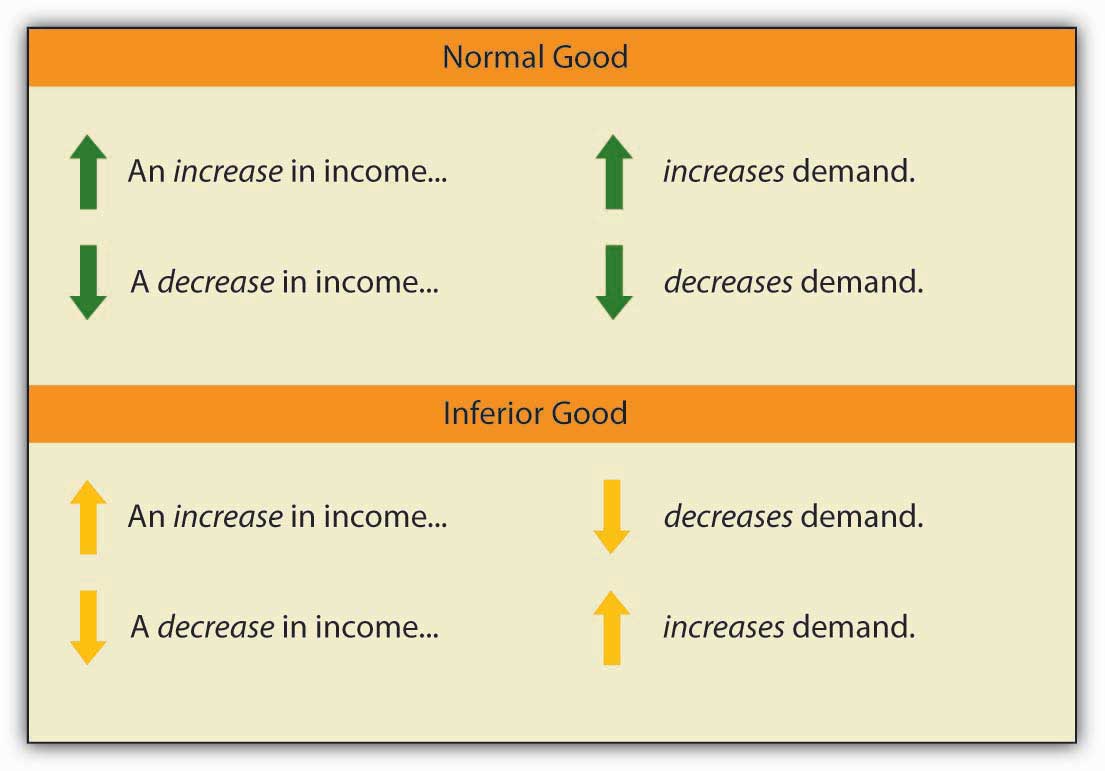
When we compute the income elasticity of demand, we are looking at the change in the quantity demanded at a specific price. We are thus dealing with a change that shifts the demand curve. An increase in income shifts the demand for a normal good to the right; it shifts the demand for an inferior good to the left.
Cross Price Elasticity of Demand
The demand for a good or service is affected by the prices of related goods or services. A reduction in the price of salsa, for example, would increase the demand for chips, suggesting that salsa is a complement of chips. A reduction in the price of chips, however, would reduce the demand for peanuts, suggesting that chips are a substitute for peanuts.
The measure economists use to describe the responsiveness of demand for a good or service to a change in the price of another good or service is called the cross price elasticity of demand, eA, B. It equals the percentage change in the quantity demanded of one good or service at a specific price divided by the percentage change in the price of a related good or service. We are varying the price of a related good when we consider the cross price elasticity of demand, so the response of quantity demanded is shown as a shift in the demand curve.
The cross price elasticity of the demand for good A with respect to the price of good B is given by:
Equation 5.5
[latex]e_{A,B} = \frac{ \% \: change \: in \: quantity \: demanded \: of \: good \: A}{ \% \: change \: in \: prince \: of \: good \: B}[/latex]
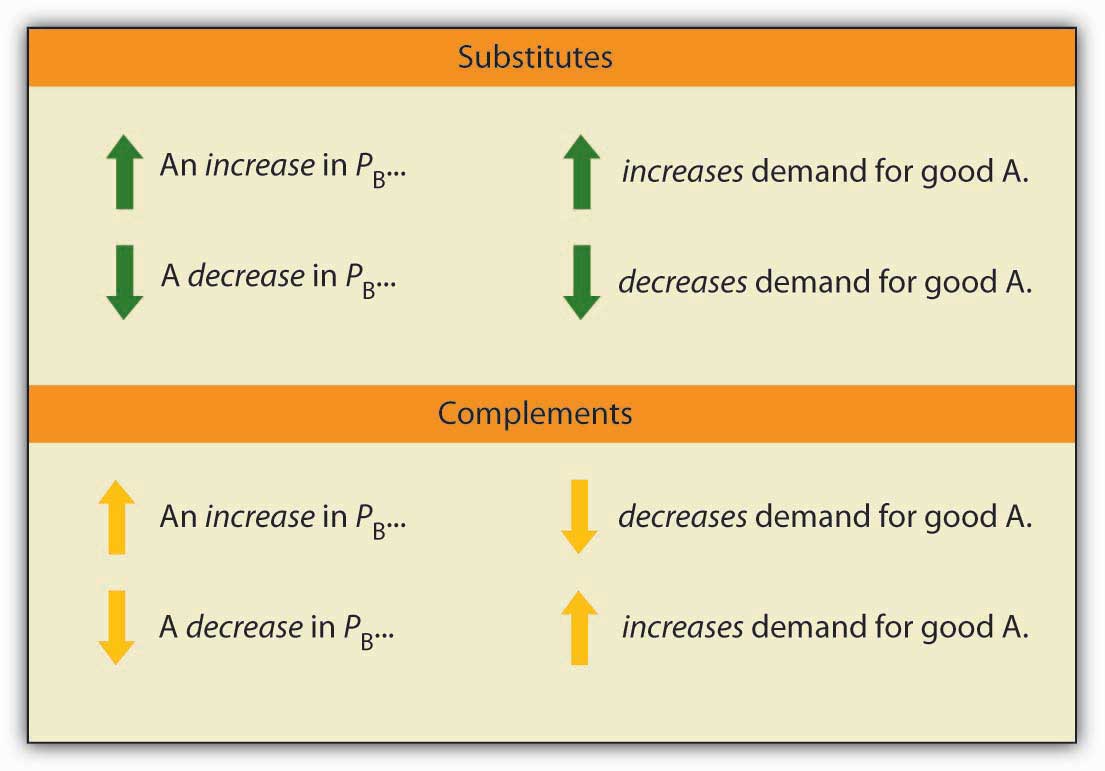
Cross price elasticities of demand define whether two goods are substitutes, complements, or unrelated. If two goods are substitutes, an increase in the price of one will lead to an increase in the demand for the other—the cross price elasticity of demand is positive. If two goods are complements, an increase in the price of one will lead to a reduction in the demand for the other—the cross price elasticity of demand is negative. If two goods are unrelated, a change in the price of one will not affect the demand for the other—the cross price elasticity of demand is zero.
Figure 5.8
An examination of the demand for local television advertising with respect to the price of local radio advertising revealed that the two goods are clearly substitutes. A 10 per cent increase in the price of local radio advertising led to a 10 per cent increase in demand for local television advertising, so that the cross price elasticity of demand for local television advertising with respect to changes in the price of radio advertising was 1.0 (Ekelund, R. B., et. al., 2000).
Heads Up!
Notice that with income elasticity of demand and cross price elasticity of demand we are primarily concerned with whether the measured value of these elasticities is positive or negative. In the case of income elasticity of demand this tells us whether the good or service is normal or inferior. In the case of cross price elasticity of demand it tells us whether two goods are substitutes or complements. With price elasticity of demand we were concerned with whether the measured absolute value of this elasticity was greater than, less than, or equal to 1, because this gave us information about what happens to total revenue as price changes. The terms elastic and inelastic apply to price elasticity of demand. They are not used to describe income elasticity of demand or cross price elasticity of demand.
Key Takeaways
- The income elasticity of demand reflects the responsiveness of demand to changes in income. It is the percentage change in quantity demanded at a specific price divided by the percentage change in income, ceteris paribus.
- Income elasticity is positive for normal goods and negative for inferior goods.
- The cross price elasticity of demand measures the way demand for one good or service responds to changes in the price of another. It is the percentage change in the quantity demanded of one good or service at a specific price divided by the percentage change in the price of another good or service, all other things unchanged.
- Cross price elasticity is positive for substitutes, negative for complements, and zero for goods or services whose demands are unrelated.
Try It!
Suppose that when the price of bagels rises by 10%, the demand for cream cheese falls by 3% at the current price, and that when income rises by 10%, the demand for bagels increases by 1% at the current price. Calculate the cross price elasticity of demand for cream cheese with respect to the price of bagels and tell whether bagels and cream cheese are substitutes or complements. Calculate the income elasticity of demand and tell whether bagels are normal or inferior.
Case in Point: Teen Smoking and Elasticity

Tobacco kills more people than any other substance or disease. Worldwide, the annual death toll from tobacco is well over 3 million people per year. In the United States alone, 400,000 people die each year as a result of their use of tobacco.
More than two-thirds of smokers indicated in 1995 that they would prefer to quit smoking but were unable to do so, according to the Centers for Disease Control and Prevention. In fact, less than 2.5 per cent of smokers succeed in quitting each year.
Most smokers begin using tobacco as teenagers. Teens tend to underestimate the danger of smoking and to overestimate their likely ability to quit smoking when they choose to do so. One can, therefore, argue that the decision to smoke may not be a rational one, and it is one that imposes substantial costs on the rest of society. Because it raises health-care costs, it raises health insurance rates. And the evidence is mounting that secondhand smoke imposes serious health consequences on nonsmokers. Because smoking is such a serious problem for our society, and because the decision to smoke is typically made when one is a teenager, health economists tend to focus on measures to prevent young people from smoking.
One place to begin in limiting teen smoking is price. The price elasticity of demand for teenage smokers is greater (in absolute value) than that for the population in general because the cost of tobacco represents a greater percentage of teen incomes than of adult incomes. For all smokers, the price elasticity of demand was estimated by economists Matthew C. Farrelly, Terry F. Pechacek, and Frank J. Chaloupka to be −0.32. Health-care economists estimate that the price elasticity of demand for cigarettes for teenagers is between −0.9 and −1.5.
In 1998, the tobacco industry reached a settlement with 46 states that had filed lawsuits against the industry, charging that the tobacco industry had imposed huge health-care costs. The Master Settlement Agreement (MSA) called for a payment of $205 billion over a period of 25 years (the other four states reached separate agreements with the industry in 1997 and 1998). The MSA led to an increase in the price of cigarettes by 48 per cent between 1997 and 1999. The percentage of high school students who smoked fell significantly by 2000, indicating a substantial responsiveness of teenagers to price changes.
The MSA also required that states use some of the money they receive from tobacco firms to carry out antismoking programs. The nature and scope of these programs vary widely. State excise taxes, also varying widely, range from 2.5¢ per pack in Virginia (a tobacco-producing state) to $1.51 in Massachusetts. Given the greater responsiveness of teenagers to the price of cigarettes, excise taxes should prove an effective device.
One caveat, however, in evaluating the impact of a tax hike on teen smoking is that some teens might switch from cigarettes to smokeless tobacco, which is associated with a higher risk of oral cancer. It is estimated that for young males the cross price elasticity of smokeless tobacco with respect to the price of cigarettes is 1.2—a 10% increase in cigarette prices leads to a 12% increase in young males using smokeless tobacco.
Sources: Matthew C. Farrelly, Terry F. Pechacek, and Frank J. Chaloupka; “The Impact of Tobacco Control Program Expenditures on Aggregate Cigarette Sales: 1981–2000,” Journal of Health Economics 22:5 (September 2003): 843–859; Michael Grossman, “Cigarette Taxes,” Public Health Reports 112:4 (July/August 1997): 290–297; Hana Ross and Frank J. Chaloupka, “The Effect of Public Policies and Prices on Youth Smoking,” Southern Economic Journal 70:4 (April 2004): 796–815; John A. Tauras. “Public Policy and Smoking Cessation among Young Adults in the United States,” Health Policy, 68:3 (June 2004): 321–332.
Answer to Try It! Problem
Using the formula for cross price elasticity of demand, we find that eAB = (−3%)/(10%) = −0.3. Since the eAB is negative, bagels and cream cheese are complements. Using the formula for income elasticity of demand, we find that eY = (+1%)/(10%) = +0.1. Since eY is positive, bagels are a normal good.
References
Bresson, G., Joyce Dargay, Jean-Loup Madre, and Alain Pirotte, “Economic and Structural Determinants of the Demand for French Transport: An Analysis on a Panel of French Urban Areas Using Shrinkage Estimators.” Transportation Research: Part A 38: 4 (May 2004): 269–285.
Ekelund, R. B., S. Ford, and John D. Jackson. “Are Local TV Markets Separate Markets?” International Journal of the Economics of Business 7:1 (2000): 79–97.
Matas, A., “Demand and Revenue Implications of an Integrated Transport Policy: The Case of Madrid.” Transport Reviews 24:2 (March 2004): 195–217.
