11.2 Oligopoly: Competition Among the Few
Learning Objectives
- Explain the main characteristics of an oligopoly, differentiating it from other types of market structures.
- Explain the measures that are used to determine the degree of concentration in an industry.
- Explain and illustrate the collusion model of oligopoly.
- Discuss how game theory can be used to understand the behavior of firms in an oligopoly.
In July, 2005, General Motors Corporation (GMC) offered “employee discount pricing” to virtually all GMC customers, not just employees and their relatives. This new marketing strategy introduced by GMC obviously affected Ford, Chrysler, Toyota and other automobile and truck manufacturers; Ford matched GMC’s employee-discount plan by offering up to $1,000 to its own employees who convinced friends to purchase its cars and trucks. Ford also offered its customers the same prices paid by its employees. By mid-July, Chrysler indicated that it was looking at many alternatives, but was waiting for GMC to make its next move. Ultimately, Chrysler also offered employee discount pricing.
Toyota had to respond. It quickly developed a new marketing strategy of its own, which included lowering the prices of its cars and offering new financing terms. The responses of Ford, Chrysler, and Toyota to GMC’s pricing strategy obviously affected the outcome of that strategy. Similarly, a decision by Procter & Gamble to lower the price of Crest toothpaste may elicit a response from Colgate-Palmolive, and that response will affect the sales of Crest. In an oligopoly, the fourth and final market structure that we will study, the market is dominated by a few firms, each of which recognizes that its own actions will produce a response from its rivals and that those responses will affect it.
The firms that dominate an oligopoly recognize that they are interdependent: What one firm does affects each of the others. This interdependence stands in sharp contrast to the models of perfect competition and monopolistic competition, where we assume that each firm is so small that it assumes the rest of the market will, in effect, ignore what it does. A perfectly competitive firm responds to the market, not to the actions of any other firm. A monopolistically competitive firm responds to its own demand, not to the actions of specific rivals. These presumptions greatly simplify the analysis of perfect competition and monopolistic competition. We do not have that luxury in oligopoly, where the interdependence of firms is the defining characteristic of the market.
Some oligopoly industries make standardized products: steel, aluminum, wire, and industrial tools. Others make differentiated products: cigarettes, automobiles, computers, ready-to-eat breakfast cereal, and soft drinks.
Measuring Concentration in Oligopoly
Oligopoly means that a few firms dominate an industry. But how many is “a few,” and how large a share of industry output does it take to “dominate” the industry?
Compare, for example, the ready-to-eat breakfast cereal industry and the ice cream industry. The cereal market is dominated by two firms, Kellogg’s and General Mills, which together hold more than half the cereal market. This oligopoly operates in a highly concentrated market. The market for ice cream, where the four largest firms account for just less than a third of output, is much less concentrated.
One way to measure the degree to which output in an industry is concentrated among a few firms is to use a concentration ratio, which reports the percentage of output accounted for by the largest firms in an industry. The higher the concentration ratio, the more the firms in the industry take account of their rivals’ behavior. The lower the concentration ratio, the more the industry reflects the characteristics of monopolistic competition or perfect competition.
The U.S. Census Bureau, based on surveys it conducts of manufacturing firms every five years, reports concentration ratios. These surveys show concentration ratios for the largest 4, 8, 20, and 50 firms in each industry category. Some concentration ratios from the 2002 survey, the latest available, are reported in Table 11.1 “Concentration Ratios and Herfindahl–Hirschman Indexes”. Notice that the four-firm concentration ratio for breakfast cereals is 78%; for ice cream it is 48%.
Table 11.1 Concentration Ratios and Herfindahl–Hirschman Indexes
| Industry | Largest 4 firms | Largest 8 firms | Largest 20 firms | Largest 50 firms | HHI |
|---|---|---|---|---|---|
| Ice cream | 48 | 64 | 82 | 93 | 736 |
| Breakfast cereals | 78 | 91 | 99 | 100 | 2521 |
| Cigarettes | 95 | 99 | 100 | *D | |
| Men’s and boys’ shirts | 38 | 53 | 73 | 89 | 481 |
| Women’s and girls’ blouses and shirts | 21 | 32 | 49 | 70 | 186 |
| Automobiles | 76 | 94 | 99 | 100 | 1911 |
| Sporting and athletic goods | 23 | 32 | 46 | 62 | 182 |
| Dental laboratories | 13 | 18 | 23 | 30 | 54 |
| *D, data withheld by the government to avoid revealing information about specific firms. | |||||
Two measures of industry concentration are reported by the Census Bureau: concentration ratios and the Herfindahl–Hirschman Index (HHI).
Source: Selected statistics from Sector 31: Manufacturing: Subject Series—Concentration Ratios: Share of Value of Shipments Accounted for by the 4, 8, 20, and 50 Largest Companies for Industries: 2002 at http://www.census.gov/epcd/www/concentration.html.
An alternative measure of concentration is found by squaring the percentage share (stated as a whole number) of each firm in an industry, then summing these squared market shares to derive a Herfindahl–Hirschman Index (HHI). The largest HHI possible is the case of monopoly, where one firm has 100% of the market; the index is 1002, or 10,000. An industry with two firms, each with 50% of total output, has an HHI of 5,000 (502 + 502). In an industry with 10,000 firms that have 0.01% of the market each, the HHI is 1. Herfindahl–Hirschman Indexes reported by the Census Bureau are also given in Table 11.1 “Concentration Ratios and Herfindahl–Hirschman Indexes”. Notice that the HHI is 2,521 for breakfast cereals and only 736 for ice cream, suggesting that the ice cream industry is more competitive than the breakfast cereal industry.
In some cases, the census data understate the degree to which a few firms dominate the market. One problem is that industry categories may be too broad to capture significant cases of industry dominance. The sporting goods industry, for example, appears to be highly competitive if we look just at measures of concentration, but markets for individual goods, such as golf clubs, running shoes, and tennis rackets, tend to be dominated by a few firms. Further, the data reflect shares of the national market. A tendency for regional domination does not show up. For example, the concrete industry appears to be highly competitive. But concrete is produced in local markets—it is too expensive to ship it very far—and many of these local markets are dominated by a handful of firms.
The census data can also overstate the degree of actual concentration. The “automobiles” category, for example, has a four-firm concentration ratio that suggests the industry is strongly dominated by four large firms (in fact, U.S. production is dominated by three: General Motors, Ford, and Chrysler). Those firms hardly account for all car sales in the United States, however, as other foreign producers have captured a large portion of the domestic market. Including those foreign competitors suggests a far less concentrated industry than the census data imply.
The Collusion Model
There is no single model of profit-maximizing oligopoly behavior that corresponds to economists’ models of perfect competition, monopoly, and monopolistic competition. Uncertainty about the interaction of rival firms makes specification of a single model of oligopoly impossible. Instead, economists have devised a variety of models that deal with the uncertain nature of rivals’ responses in different ways. In this section we review one type of oligopoly model, the collusion model. After examining this traditional approach to the analysis of oligopoly behavior, we shall turn to another method of examining oligopolistic interaction: game theory.
Firms in any industry could achieve the maximum profit attainable if they all agreed to select the monopoly price and output and to share the profits. One approach to the analysis of oligopoly is to assume that firms in the industry collude, selecting the monopoly solution.
Suppose an industry is a duopoly, an industry with two firms. Figure 11.5 “Monopoly Through Collusion” shows a case in which the two firms are identical. They sell identical products and face identical demand and cost conditions. To simplify the analysis, we will assume that each has a horizontal marginal cost curve, MC. The demand and marginal revenue curves are the same for both firms. We find the combined demand curve for the two firms, Dcombined, by adding the individual demand curves together. Because one firm’s demand curve, Dfirm, represents one-half of market demand, it is the same as the combined marginal revenue curve for the two firms. If these two firms act as a monopoly, together they produce Qm and charge a price Pm. This result is achieved if each firm selects its profit-maximizing output, which equals 1/2 Qm. This solution is inefficient; the efficient solution is price Pc and output Qc, found where the combined market demand curve Dcombined and the marginal cost curve MC intersect.
Figure 11.5 Monopoly Through Collusion
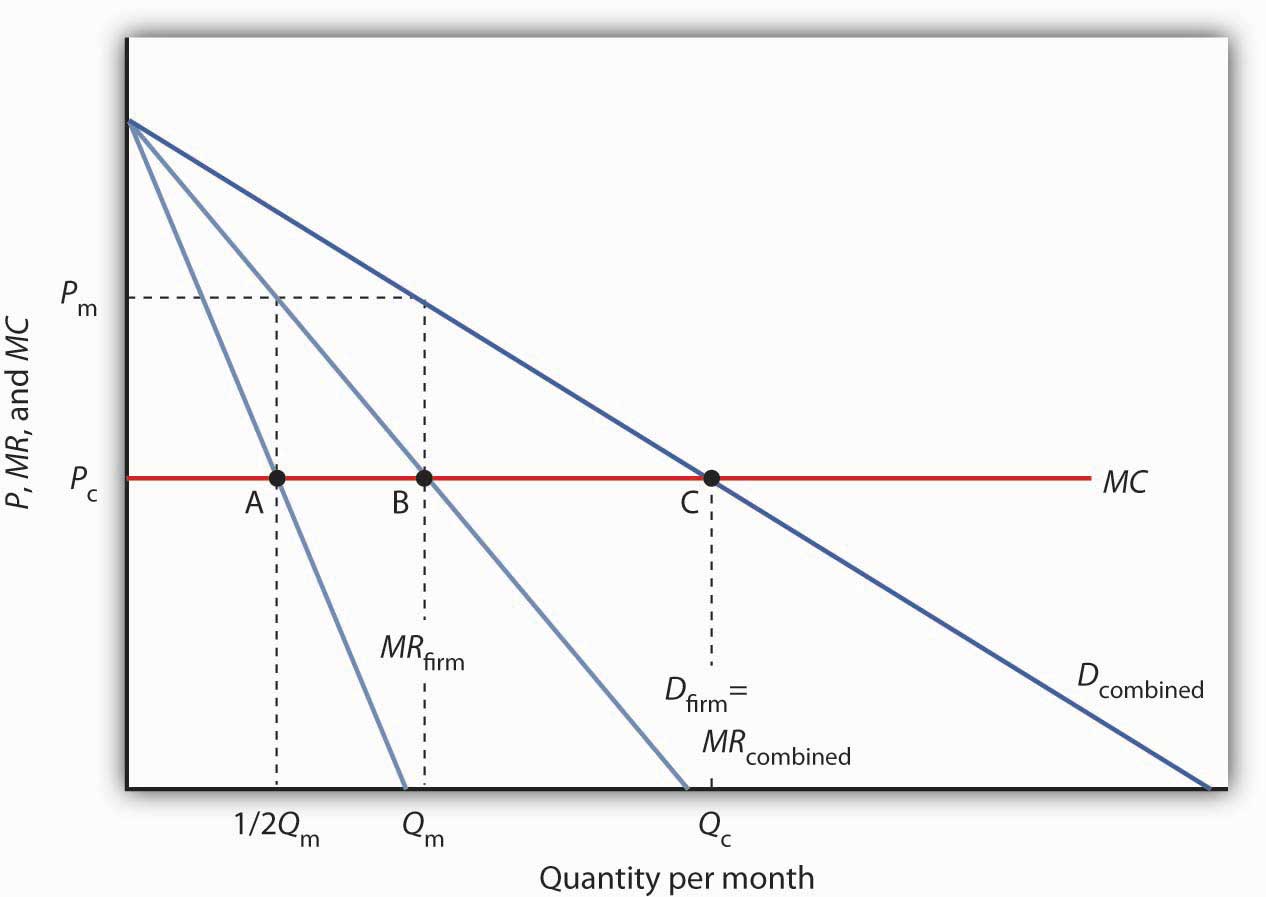
Two identical firms have the same horizontal marginal cost curve MC. Their demand curves Dfirm and marginal revenue curves MRfirm are also identical. The combined demand curve is Dcombined; the combined marginal revenue curve is MRcombined. The profits of the two firms are maximized if each produces 1/2 Qm at point A. Industry output at point B is thus Qm and the price is Pm. At point C, the efficient solution output would be Qc, and the price would equal MC.
In the simplest form of collusion, overt collusion, firms openly agree on price, output, and other decisions aimed at achieving monopoly profits. Firms that coordinate their activities through overt collusion and by forming collusive coordinating mechanisms make up a cartel.
Firms form a cartel to gain monopoly power. A successful cartel can earn large profits, but there are several problems with forming and maintaining one. First, in many countries, including the United States, cartels are generally illegal1. They are banned, because their purpose is to raise prices and restrict output. Second, the cartel may not succeed in inducing all firms in the industry to join. Firms that remain outside the cartel can compete by lowering price, and thus they prevent the cartel from achieving the monopoly solution. Third, there is always an incentive for individual members to cheat on cartel agreements. Suppose the members of a cartel have agreed to impose the monopoly price in their market and to limit their output accordingly. Any one firm might calculate that it could charge slightly less than the cartel price and thus capture a larger share of the market for itself. Cheating firms expand output and drive prices down below the level originally chosen.
The Organization of Petroleum Exporting Countries (OPEC), perhaps the best-known cartel, is made up of 13 oil-producing countries. In the 1970s, OPEC successfully acted like a monopoly by restricting output and raising prices. By the mid-1980s, however, the monopoly power of the cartel had been weakened by expansion of output by nonmember producers such as Mexico and Norway and by cheating among the cartel members.
An alternative to overt collusion is tacit collusion, an unwritten, unspoken understanding through which firms agree to limit their competition. Firms may, for example, begin following the price leadership of a particular firm, raising or lowering their prices when the leader makes such a change. The price leader may be the largest firm in the industry, or it may be a firm that has been particularly good at assessing changes in demand or cost. At various times, tacit collusion has been alleged to occur in a wide range of industries, including steel, cars, and breakfast cereals.
It is difficult to know how common tacit collusion is. The fact that one firm changes its price shortly after another one does cannot prove that a tacit conspiracy exists. After all, we expect to see the prices of all firms in a perfectly competitive industry moving together in response to changes in demand or production costs.
Game Theory and Oligopoly Behavior
Oligopoly presents a problem in which decision makers must select strategies by taking into account the responses of their rivals, which they cannot know for sure in advance. The Start Up feature at the beginning of this chapter suggested the uncertainty eBay faces as it considers the possibility of competition from Google. A choice based on the recognition that the actions of others will affect the outcome of the choice and that takes these possible actions into account is called a strategic choice. Game theory is an analytical approach through which strategic choices can be assessed.
Among the strategic choices available to an oligopoly firm are pricing choices, marketing strategies, and product-development efforts. An airline’s decision to raise or lower its fares—or to leave them unchanged—is a strategic choice. The other airlines’ decision to match or ignore their rival’s price decision is also a strategic choice. IBM boosted its share in the highly competitive personal computer market in large part because a strategic product-development strategy accelerated the firm’s introduction of new products.
Once a firm implements a strategic decision, there will be an outcome. The outcome of a strategic decision is called a payoff. In general, the payoff in an oligopoly game is the change in economic profit to each firm. The firm’s payoff depends partly on the strategic choice it makes and partly on the strategic choices of its rivals. Some firms in the airline industry, for example, raised their fares in 2005, expecting to enjoy increased profits as a result. They changed their strategic choices when other airlines chose to slash their fares, and all firms ended up with a payoff of lower profits—many went into bankruptcy.
We shall use two applications to examine the basic concepts of game theory. The first examines a classic game theory problem called the prisoners’ dilemma. The second deals with strategic choices by two firms in a duopoly.
The Prisoners’ Dilemma
Suppose a local district attorney (DA) is certain that two individuals, Frankie and Johnny, have committed a burglary, but she has no evidence that would be admissible in court.
The DA arrests the two. On being searched, each is discovered to have a small amount of cocaine. The DA now has a sure conviction on a possession of cocaine charge, but she will get a conviction on the burglary charge only if at least one of the prisoners confesses and implicates the other.
The DA decides on a strategy designed to elicit confessions. She separates the two prisoners and then offers each the following deal: “If you confess and your partner doesn’t, you will get the minimum sentence of one year in jail on the possession and burglary charges. If you both confess, your sentence will be three years in jail. If your partner confesses and you do not, the plea bargain is off and you will get six years in prison. If neither of you confesses, you will each get two years in prison on the drug charge.”
The two prisoners each face a dilemma; they can choose to confess or not confess. Because the prisoners are separated, they cannot plot a joint strategy. Each must make a strategic choice in isolation.
The outcomes of these strategic choices, as outlined by the DA, depend on the strategic choice made by the other prisoner. The payoff matrix for this game is given in Figure 11.6 “Payoff Matrix for the Prisoners’ Dilemma”. The two rows represent Frankie’s strategic choices; she may confess or not confess. The two columns represent Johnny’s strategic choices; he may confess or not confess. There are four possible outcomes: Frankie and Johnny both confess (cell A), Frankie confesses but Johnny does not (cell B), Frankie does not confess but Johnny does (cell C), and neither Frankie nor Johnny confesses (cell D). The portion at the lower left in each cell shows Frankie’s payoff; the shaded portion at the upper right shows Johnny’s payoff.
Figure 11.6 Payoff Matrix for the Prisoners’ Dilemma
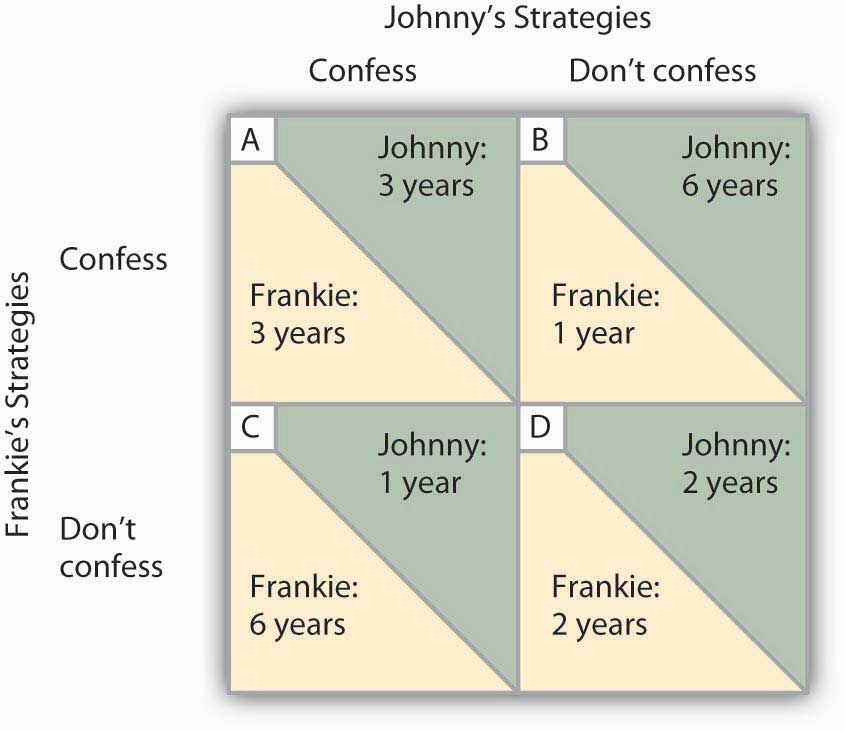
The four cells represent each of the possible outcomes of the prisoners’ game.
If Johnny confesses, Frankie’s best choice is to confess—she will get a three-year sentence rather than the six-year sentence she would get if she did not confess. If Johnny does not confess, Frankie’s best strategy is still to confess—she will get a one-year rather than a two-year sentence. In this game, Frankie’s best strategy is to confess, regardless of what Johnny does. When a player’s best strategy is the same regardless of the action of the other player, that strategy is said to be a dominant strategy. Frankie’s dominant strategy is to confess to the burglary.
For Johnny, the best strategy to follow, if Frankie confesses, is to confess. The best strategy to follow if Frankie does not confess is also to confess. Confessing is a dominant strategy for Johnny as well. A game in which there is a dominant strategy for each player is called a dominant strategy equilibrium. Here, the dominant strategy equilibrium is for both prisoners to confess; the payoff will be given by cell A in the payoff matrix.
From the point of view of the two prisoners together, a payoff in cell D would have been preferable. Had they both denied participation in the robbery, their combined sentence would have been four years in prison—two years each. Indeed, cell D offers the lowest combined prison time of any of the outcomes in the payoff matrix. But because the prisoners cannot communicate, each is likely to make a strategic choice that results in a more costly outcome. Of course, the outcome of the game depends on the way the payoff matrix is structured.
Repeated Oligopoly Games
The prisoners’ dilemma was played once, by two players. The players were given a payoff matrix; each could make one choice, and the game ended after the first round of choices.
The real world of oligopoly has as many players as there are firms in the industry. They play round after round: a firm raises its price, another firm introduces a new product, the first firm cuts its price, a third firm introduces a new marketing strategy, and so on. An oligopoly game is a bit like a baseball game with an unlimited number of innings—one firm may come out ahead after one round, but another will emerge on top another day. In the computer industry game, the introduction of personal computers changed the rules. IBM, which had won the mainframe game quite handily, struggles to keep up in a world in which rivals continue to slash prices and improve quality.
Oligopoly games may have more than two players, so the games are more complex, but this does not change their basic structure. The fact that the games are repeated introduces new strategic considerations. A player must consider not just the ways in which its choices will affect its rivals now, but how its choices will affect them in the future as well.
We will keep the game simple, however, and consider a duopoly game. The two firms have colluded, either tacitly or overtly, to create a monopoly solution. As long as each player upholds the agreement, the two firms will earn the maximum economic profit possible in the enterprise.
There will, however, be a powerful incentive for each firm to cheat. The monopoly solution may generate the maximum economic profit possible for the two firms combined, but what if one firm captures some of the other firm’s profit? Suppose, for example, that two equipment rental firms, Quick Rent and Speedy Rent, operate in a community. Given the economies of scale in the business and the size of the community, it is not likely that another firm will enter. Each firm has about half the market, and they have agreed to charge the prices that would be chosen if the two combined as a single firm. Each earns economic profits of $20,000 per month.
Quick and Speedy could cheat on their arrangement in several ways. One of the firms could slash prices, introduce a new line of rental products, or launch an advertising blitz. This approach would not be likely to increase the total profitability of the two firms, but if one firm could take the other by surprise, it might profit at the expense of its rival, at least for a while.
We will focus on the strategy of cutting prices, which we will call a strategy of cheating on the duopoly agreement. The alternative is not to cheat on the agreement. Cheating increases a firm’s profits if its rival does not respond. Figure 11.7 “To Cheat or Not to Cheat: Game Theory in Oligopoly” shows the payoff matrix facing the two firms at a particular time. As in the prisoners’ dilemma matrix, the four cells list the payoffs for the two firms. If neither firm cheats (cell D), profits remain unchanged.
Figure 11.7 To Cheat or Not to Cheat: Game Theory in Oligopoly
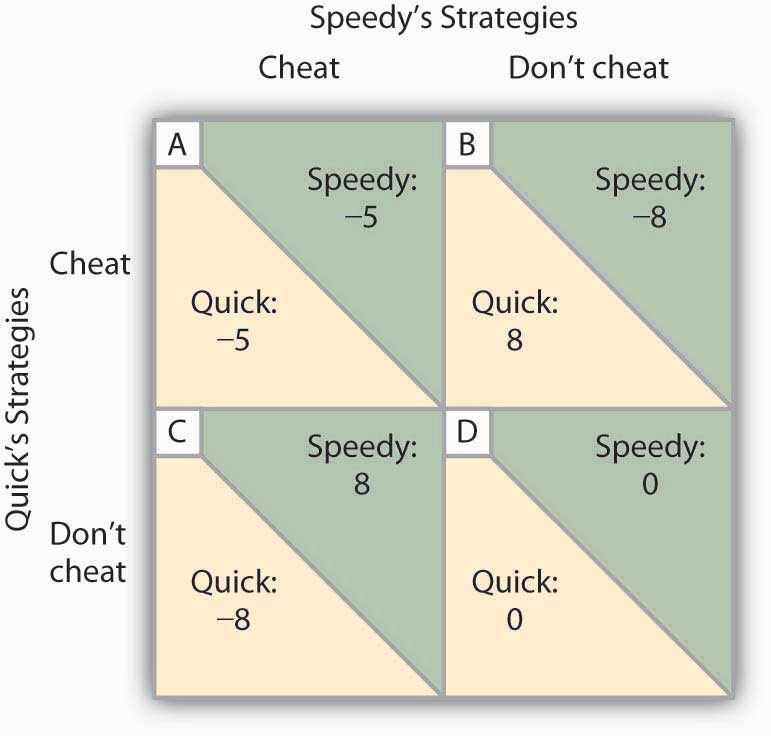
Two rental firms, Quick Rent and Speedy Rent, operate in a duopoly market. They have colluded in the past, achieving a monopoly solution. Cutting prices means cheating on the arrangement; not cheating means maintaining current prices. The payoffs are changes in monthly profits, in thousands of dollars. If neither firm cheats, then neither firm’s profits will change. In this game, cheating is a dominant strategy equilibrium.
This game has a dominant strategy equilibrium. Quick’s preferred strategy, regardless of what Speedy does, is to cheat. Speedy’s best strategy, regardless of what Quick does, is to cheat. The result is that the two firms will select a strategy that lowers their combined profits!
Quick Rent and Speedy Rent face an unpleasant dilemma. They want to maximize profit, yet each is likely to choose a strategy inconsistent with that goal. If they continue the game as it now exists, each will continue to cut prices, eventually driving prices down to the point where price equals average total cost (presumably, the price-cutting will stop there). But that would leave the two firms with zero economic profits.
Both firms have an interest in maintaining the status quo of their collusive agreement. Overt collusion is one device through which the monopoly outcome may be maintained, but that is illegal. One way for the firms to encourage each other not to cheat is to use a tit-for-tat strategy. In a tit-for-tat strategy a firm responds to cheating by cheating, and it responds to cooperative behavior by cooperating. As each firm learns that its rival will respond to cheating by cheating, and to cooperation by cooperating, cheating on agreements becomes less and less likely.
Still another way firms may seek to force rivals to behave cooperatively rather than competitively is to use a trigger strategy, in which a firm makes clear that it is willing and able to respond to cheating by permanently revoking an agreement. A firm might, for example, make a credible threat to cut prices down to the level of average total cost—and leave them there—in response to any price-cutting by a rival. A trigger strategy is calculated to impose huge costs on any firm that cheats—and on the firm that threatens to invoke the trigger. A firm might threaten to invoke a trigger in hopes that the threat will forestall any cheating by its rivals.
Game theory has proved to be an enormously fruitful approach to the analysis of a wide range of problems. Corporations use it to map out strategies and to anticipate rivals’ responses. Governments use it in developing foreign-policy strategies. Military leaders play war games on computers using the basic ideas of game theory. Any situation in which rivals make strategic choices to which competitors will respond can be assessed using game theory analysis.
One rather chilly application of game theory analysis can be found in the period of the Cold War when the United States and the former Soviet Union maintained a nuclear weapons policy that was described by the acronym MAD, which stood for mutually assured destruction. Both countries had enough nuclear weapons to destroy the other several times over, and each threatened to launch sufficient nuclear weapons to destroy the other country if the other country launched a nuclear attack against it or any of its allies. On its face, the MAD doctrine seems, well, mad. It was, after all, a commitment by each nation to respond to any nuclear attack with a counterattack that many scientists expected would end human life on earth. As crazy as it seemed, however, it worked. For 40 years, the two nations did not go to war. While the collapse of the Soviet Union in 1991 ended the need for a MAD doctrine, during the time that the two countries were rivals, MAD was a very effective trigger indeed.
Of course, the ending of the Cold War has not produced the ending of a nuclear threat. Several nations now have nuclear weapons. The threat that Iran will introduce nuclear weapons, given its stated commitment to destroy the state of Israel, suggests that the possibility of nuclear war still haunts the world community.
Key Takeaways
- The key characteristics of oligopoly are a recognition that the actions of one firm will produce a response from rivals and that these responses will affect it. Each firm is uncertain what its rivals’ responses might be.
- The degree to which a few firms dominate an industry can be measured using a concentration ratio or a Herfindahl–Hirschman Index.
- One way to avoid the uncertainty firms face in oligopoly is through collusion. Collusion may be overt, as in the case of a cartel, or tacit, as in the case of price leadership.
- Game theory is a tool that can be used to understand strategic choices by firms.
- Firms can use tit-for-tat and trigger strategies to encourage cooperative behavior by rivals.
Try It!
Which model of oligopoly would seem to be most appropriate for analyzing firms’ behavior in each of the situations given below?
- When South Airlines lowers its fare between Miami and New York City, North Airlines lowers its fare between the two cities. When South Airlines raises its fare, North Airlines does too.
- Whenever Bank A raises interest rates on car loans, other banks in the area do too.
- In 1986, Saudi Arabia intentionally flooded the market with oil in order to punish fellow OPEC members for cheating on their production quotas.
- In July 1998, Saudi Arabia floated a proposal in which a group of eight or nine major oil-exporting countries (including OPEC members and some nonmembers, such as Mexico) would manage world oil prices by adjusting their production.
Case in Point: Memory Chip Makers Caught in Global Price-Fixing Scheme

It may have been the remark by T.L. Chang, vice president of the Taiwan-based memory chip manufacturer Mosel-Vitelic that sparked the investigation by the U.S. Department of Justice Antitrust Division. Mr. Chang was quoted in Taiwan’s Commercial Times in May 2002 as admitting to price-fixing meetings held in Asia among the major producers of DRAM, or dynamic random access memory. DRAM is the most common semi-conductor main memory format for storage and retrieval of information that is used in personal computers, mobile phones, digital cameras, MP3 music players, and other electronics products. At those meetings, as well as through emails and telephone conferences, the main manufacturers of DRAM decided not only what prices to charge and how much to make available, but also exchanged information on DRAM sales for the purpose of monitoring and enforcing adherence to the agreed prices. The collusion lasted for three years—from 1999 to 2002. In December 2001, DRAM prices were less than $1.00. By May of 2002, price had risen to the $4 to $5 range.
The companies that were directly injured by the higher chip prices included Dell, Compaq, Hewlett-Packard, Apple, IBM, and Gateway. In the end, though, the purchasers of their products paid in the form of higher prices or less memory.
In December 2003, a Micron Technology sales manager pled guilty to obstruction of justice and served six months of home detention. The first chipmaker to plead guilty a year later was Germany-based Infineon Technologies, which was fined $160 million. As of September 2007, five companies, Samsung being the largest, had been charged fines of more than $732 million, and over 3,000 days of jail time had been meted out to eighteen corporate executives.
The sharp reduction in the number of DRAM makers in the late 1990s undoubtedly made it easier to collude. The industry is still quite concentrated with Samsung holding 27.7% of the market and Hynix 21.3%. The price, however, has fallen quite sharply in recent years.
Sources: Department of Justice, “Sixth Samsung Executive Agrees to Plead Guilty to Participating in DRAM Price-Fixing Cartel,” Press Release April 19, 2007; Stephen Labaton, “Infineon To Pay a Fine in the Fixing of Chip Prices,” The New York Times, September 16, 2004; George Leopold and David Lammers, “DRAMs Under Gun in Antitrust Probe”, Electronic Engineering Times, 1124 (June 24, 2002):1, 102; Lee Sun-Young, “Samsung Cements DRAM Leadership,” Korea Herald, online, March 31, 2008.
Answers to Try It! Problems
- North Airlines seems to be practicing a price strategy known in game theory as tit-for-tat.
- The banks could be engaged in tacit collusion, with Bank A as the price leader.
- Saudi Arabia appears to have used a trigger strategy, another aspect of game theory. In general, of course, participants hope they will never have to “pull” the trigger, because doing so harms all participants. After years of cheating by other OPEC members, Saudi Arabia did undertake a policy that hurt all members of OPEC, including itself; OPEC has never since regained the prominent role it played in oil markets.
- Saudi Arabia seems to be trying to create another oil cartel, a form of overt collusion.
1One legal cartel is the NCAA, which many economists regard as a successful device through which member firms (colleges and universities) collude on a wide range of rules through which they produce sports.
