12.4 Financial Statement Analysis
Learning Objective
- Evaluate a company’s performance using financial statements and ratio analysis.
Now that you know how financial statements are prepared, let’s see how they’re used to help owners, managers, investors, and creditors assess a firm’s performance and financial strength. You can glean a wealth of information from financial statements, but first you need to learn a few basic principles for “unlocking” it.
The Comparative Income Statement
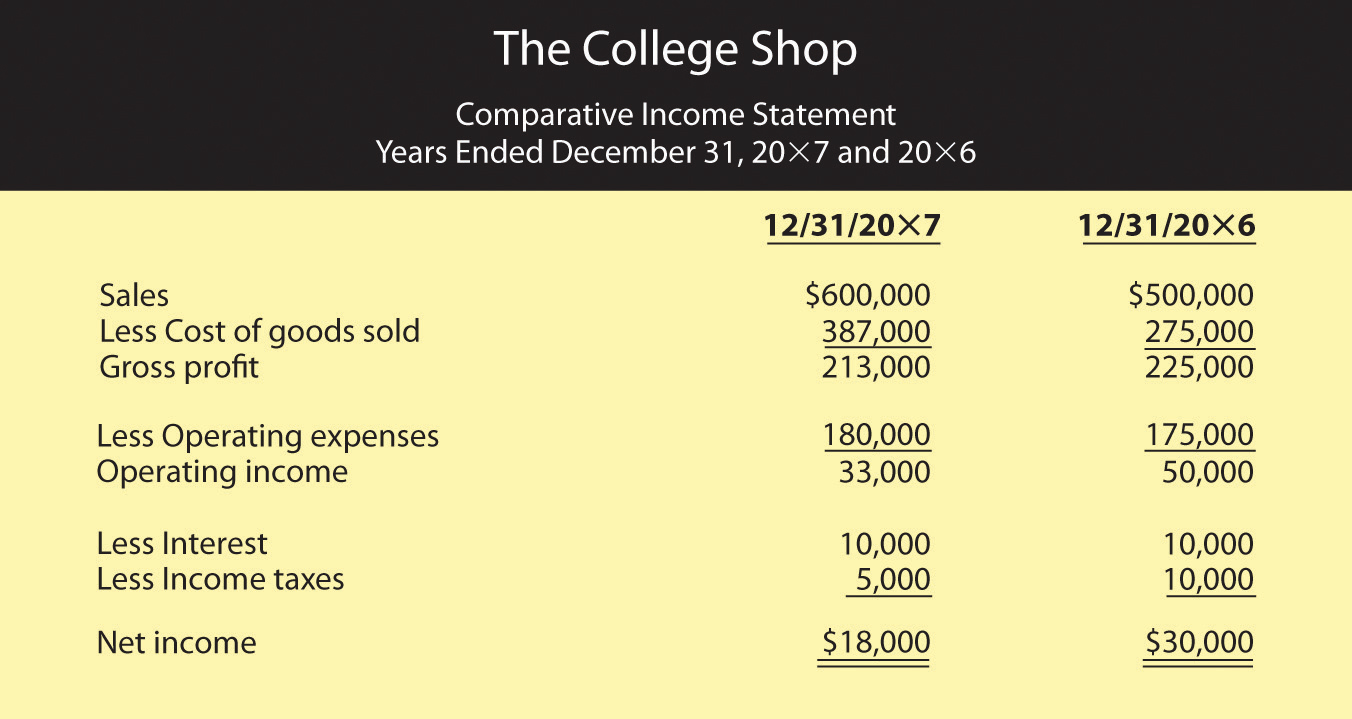
Let’s fast-forward again and assume that your business—The College Shop—has just completed its second year of operations. After creating your second-year income statement, you decide to compare the numbers from this statement with those from your first statement. So you prepare the comparative income statement in Figure 12.19 “Comparative Income Statement for The College Shop”, which shows income figures for year 2 and year 1 (accountants generally put numbers for the most recent year in the inside column).
Figure 12.19 Comparative Income Statement for The College Shop
Vertical Percentage Analysis
What does this statement tell us about your second year in business? Some things look good and some don’t. Your sales went up from $500,000 to $600,000 (a 20 percent increase—not bad). But your profit was down—from $30,000 to $18,000 (a bad sign). As you stare at the statement, you’re asking yourself the question: Why did my profit go down even though my sales went up? Does this result make sense? Is there some way of comparing two income statements that will give me a more helpful view of my company’s financial health? One way is called vertical percentage analysis. It’s useful because it reveals the relationship of each item on the income statement to a specified base—generally sales—by expressing each item as a percentage of that base.
Figure 12.20 “Comparative Income Statement Using Vertical Percentage Analysis” shows what comparative income statements look like when you use vertical percentage analysis showing each item as a percentage of sales. Let’s see if this helps clarify things. What do you think accounted for the company’s drop in income even though The College Shop sales went up?
Figure 12.20 Comparative Income Statement Using Vertical Percentage Analysis
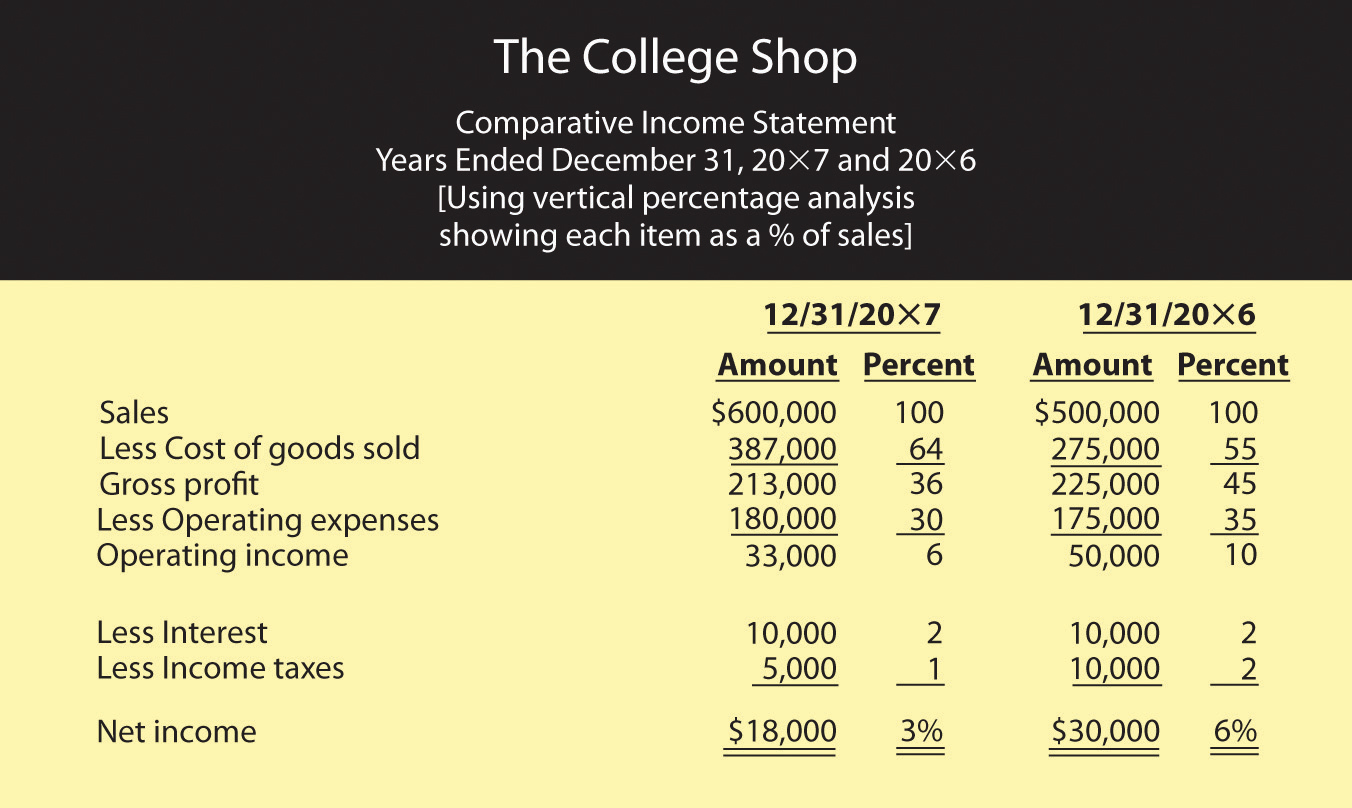
The percentages help you to analyze changes in the income statement items over time, but it might be easier if you think of the percentages as pennies. In year 1, for example, for every $1.00 of sales, $0.55 went to pay for the goods that you sold, leaving $0.45 to cover your other costs and leave you a profit. Operating expenses (salaries, rent, advertising, and so forth) used up $0.35 of every $1.00 of sales, while interest and taxes took up $0.02 each. After you covered all your costs, you had $0.06 profit for every $1.00 of sales.
Asking the Right Questions
Now, compare these figures to those for year 2. Where is the major discrepancy? It’s in Cost of goods sold. Instead of using $0.55 of every $1.00 of sales to buy the goods you sold, you used $0.64. As a result, you had $0.09 less ($0.64 – $0.55) to cover other costs. This is the major reason why you weren’t as profitable in year 2 as you were in year 1: your Gross profit as a percentage of sales was lower in year 2 than it was in year 1. Though this information doesn’t give you all the answers you’d like to have, it does, however, raise some interesting questions. Why was there a change in the relationship between Sales and Cost of goods sold? Did you have to pay more to buy goods for resale and, if so, were you unable to increase your selling price to cover the additional cost? Did you have to reduce prices to move goods that weren’t selling well? (If your costs stay the same but your selling price goes down, you make less on each item sold.) Answers to these questions require further analysis, but at least you know what the useful questions are.
Ratio Analysis
Vertical percentage analysis helps you analyze relationships between items on your income statement. But how do you compare your financial results with those of other companies in your industry or with the industry overall? And what about your balance sheet? Are there relationships on this statement that also warrant investigation? Should you further examine any relationships between items on your income statement and items on your balance sheet? These issues can be explored by using ratio analysis, a technique for evaluating a company’s financial performance.
First, remember that a ratio is just one number divided by another, with the result expressing the relationship between the two numbers. Let’s say, for example, that you want to know the relationship between the cost of going to a movie and the cost of renting a DVD movie. You could make the following calculation:
[latex]\frac{Cost\;of\;going\;to\;a\;movie}{Cost\;of\;renting\;a\;movie}=\frac{\$8}{\$4}=2(or\;2\;to\;1)[/latex]
Going to a movie costs two times as much as renting a DVD.
Ratio analysis is also used to assess a company’s performance over time and to compare one company to similar companies or to the overall industry in which it operates. You don’t learn much from just one ratio, or even a number of ratios covering the same period. Rather, the value in ratio analysis lies in looking at the trend of ratios over time and in comparing the ratios for several time periods with those of competitors and the industry as a whole. There are a number of different ways to categorize financial ratios. Here’s just one set of categories:
- Profit margin ratios tell you how much of each sales dollar is left after certain costs are covered.
- Management efficiency ratios tell you how efficiently your assets are being managed.
- Management effectiveness ratios tell you how effective management is at running the business and measure overall company performance.
- Financial condition ratios help you assess a firm’s financial strength.
Using each of these categories, we can find dozens of different ratios, but we’ll focus on a few examples.
Profit Margin Ratios
We’ve already determined the two most common profit margin ratios—gross profit margin and net profit margin—when we used vertical percentage analysis to determine the relationship to Sales of each item on The College Shop’s income statement. We were examining gross profit when we found that Gross profit for year 1 was 45 percent of Sales and that, in year 2, it had declined to 36 percent. We can express the same relationships as ratios:
[latex]Gross\;profit\;margin=\frac{Gross profit}{Sales}[/latex]
[latex]Year\;1: \;\frac{\$225,000}{\$500,000}=45\%[/latex]
[latex]Year\;2: \;\frac{\$213,000}{\$600,000}=36\%(rounded)[/latex]
We can see that gross profit margin declined (a situation that, as we learned earlier, probably isn’t good). But how can you tell whether your gross profit margin for year 2 is appropriate for your company? For one thing, we can use it to compare The College Shop’s results to those of its industry. When we make this comparison, we find that the specialized retail industry (in which your company operates) reports an average gross profit margin of 41 percent. For year 1, therefore, we had a higher ratio than the industry; in year 2, though we had a lower ratio, we were still in the proverbial ballpark.
It’s worthwhile to track gross profit margin, whether for your company or for companies that you might invest in or lend money to. In particular, you’ll gain some insight into changes that might be occurring in a business. For instance, what if you discover that a firm’s gross profit margin has declined? Is it because it’s costing more for the company to buy or make its products, or is it because its competition is forcing it to lower its prices?
Net Profit Margin
Net profit is the money that a company earns after paying all its expenses, including the costs of buying or making its products, running its operations, and paying interest and taxes. Look again at Figure 12.20 “Comparative Income Statement Using Vertical Percentage Analysis”. Using vertical percentage analysis, we found that for The College Shop, net profit as a percentage of sales was 6 percent in year 1 but declined to 3 percent in year 2. Expressed as ratios, these relationships would look like this:
[latex]Net\;profit\;margin=\frac{Net\;profit}{Sales}[/latex]
[latex]Year\;1: \;\frac{\$30,000}{\$500,000}=6\%[/latex]
[latex]Year\;2: \;\frac{\$18,000}{\$600,000}=3\%(rounded)[/latex]
You realize that a declining net profit margin isn’t good, but you wonder how you compare with your industry. A little research informs you that average net profit margin in the industry is 7 percent. You performed nearly as well as the industry in year 1 but fell further from your target in year 2. What does this information tell you? That a goal for year 3 should be trying to increase your net profit margin.
Management Efficiency Ratios
These ratios reveal the way in which assets (shown on the balance sheet) are being used to generate income (shown on the income statement). To compute this group of ratios, therefore, you must look at both statements. In Figure 12.19 “Comparative Income Statement for The College Shop”, we produced a comparative income statement for The College Shop’s first two years. Figure 12.21 “Comparative Balance Sheet for The College Shop” is a comparative balance sheet for the same period.
Figure 12.21 Comparative Balance Sheet for The College Shop
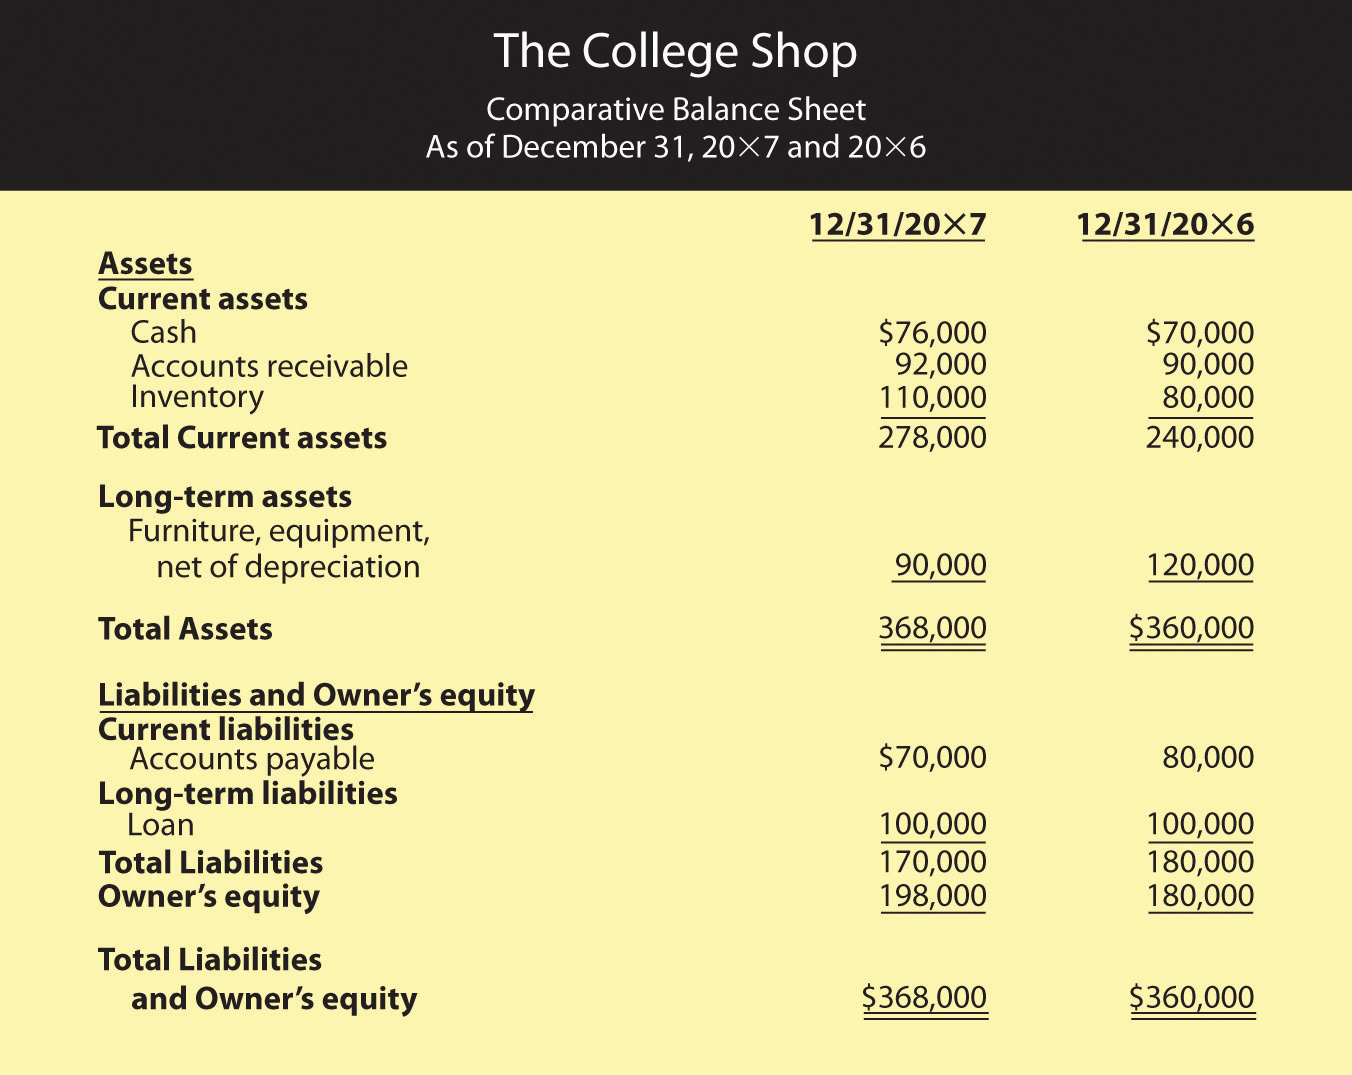
As you can see from Figure 12.21 “Comparative Balance Sheet for The College Shop”, running even a small business entails a substantial investment in assets. Even if you rent space, for example, you must still buy furniture and equipment. To have products on hand to sell, you need to tie up money in inventory. And once you’ve sold them, you may have money tied up in accounts receivable while you’re waiting for customers to pay you. Thus, investing in assets is a normal part of doing business. Managing your assets efficiently is a basic requirement of business success. Let’s look at a representative management efficiency ratio. The inventory turnover ratio measures a firm’s efficiency in selling its inventory.
You don’t make money from unsold inventory. You make money when you sell inventory, and the faster you sell it, the more money you make. To determine how fast your inventory is “turning,” you need to examine the relationship between sales and inventory1. Let’s see how well The College Shop is doing in moving its inventory:
[latex]Inventory\;turnover=\frac{Sales}{Inventory}[/latex]
[latex]Year\;1: \;\frac{\$500,000}{\$80,000}=6.25times[/latex]
[latex]Year\;2: \;\frac{\$600,000}{\$110,000}=5.45times[/latex]
For year 1, The College Shop converted its inventory into sales 6.25 times: on average, your entire inventory was sold and replaced 6.25 times during the year. For year 2, however, inventory was converted into sales only 5.45 times. The industry did better, averaging turnover of 6.58 times. Before we discuss possible reasons for the drop in The College Shop’s inventory turnover ratio, let’s look at an alternative way of describing this ratio. Simply convert this ratio into the average number of days that you held an item in inventory. In other words, divide 365 days by your turnover ratio:
[latex]Year\;1:\;365/6.25=58\;days[/latex]
[latex]Year\;2:\;365/5.45=67\;days[/latex]
[latex]Industry:365/6.58=55\;days[/latex]
The College Shop was doing fine in year 1 (relative to the industry), but something happened in year 2 to break your stride. Holding onto inventory for an extra 9 days (67 days for year 2 minus 58 days for year 1) is costly. What happened? Perhaps inventory levels were too high because you overstocked. It’s good to have products available for customers, but stocking too much inventory is costly. Maybe some of your inventory takes a long time to sell because it’s not as appealing to customers as you thought. If this is the case, you may have a problem for the next year because you’ll have to cut prices (and reduce profitability) in order to sell the same slow-moving inventory.
Optimal inventory turnover varies by industry and even by company. A supermarket, for example, will have a high inventory turnover because many of its products are perishable and because it makes money by selling a high volume of goods (making only pennies on each sale). A company that builds expensive sailboats, by contrast, will have a low inventory turnover: it sells few boats but makes a hefty profit on each one. Some companies, such as Dell Computer, are known for keeping extremely low inventory levels. Because computers are made to order, Dell maintains only minimal inventory and so enjoys a very high ratio of sales to inventory.
Management Effectiveness Ratios
“It takes money to make money,” goes the old saying, and it’s true. Even the smallest business uses money to grow. Management effectiveness ratios address the question: how well is a company performing with the money that owners and others have invested in it?
These ratios are widely regarded as the best measure of corporate performance. You can give a firm high marks for posting good profit margins or for turning over its inventory quickly, but the final grade depends on how much profit it generates with the money invested by owners and creditors. Or, to put it another way, that grade depends on the answer to the question: is the company making a sufficiently high return on its assets?
Like management efficiency ratios, management effectiveness ratios examine the relationship between items on the income statement and items on the balance sheet. From the income statement you always need to know the “bottom line”—net profit. The information that you need from the balance sheet varies according to the ratio that you’re trying to calculate, but it’s always some measure of the amount of capital used in the business. Common measures of capital investment include total equity, total assets, or a combination of equity and long-term debt. Let’s see whether The College Shop made the grade. Did it generate a reasonable profit on the assets invested in the company?
[latex]Return\;on\;assets=\frac{Net\;Profit}{Total\;assets}[/latex]
[latex]Year\;1: \;\frac{\$30,000}{\$360,000}=8.3\%[/latex]
[latex]Year\;2: \;\frac{\$18,000}{\$368,000}=4.9\%[/latex]
Because the industry average return on assets is 7.9 percent, The College Shop gets an “A” for its first year’s performance. It slipped in the second year but is probably still in the “B” range.
Financial Condition Ratios
Financial condition ratios measure the financial strength of a company. They assess its ability to pay its current bills; and to determine whether its debt load is reasonable, they examine the proportion of its debt to its equity.
Current Ratio
Let’s look first at a company’s ability to meet current obligations. The ratio that evaluates this ability is called the current ratio, which examines the relationship between a company’s current assets and its current liabilities. The balance of The College Shop’s current assets and current liabilities appears on the comparative balance sheet in Figure 12.21 “Comparative Balance Sheet for The College Shop”. By calculating its current ratio, we’ll see whether the business is likely to have trouble paying its current liabilities.
[latex]Current\;ration=\frac{Current\;assets}{Current\;liabilities}[/latex]
[latex]Year\;1:\frac{\$240,000}{\$80,000}=3\;to\;1[/latex]
[latex]Year\;2:\frac{\$278,000}{\$70,000}=4\;to\;1[/latex]
The College Shop’s current ratio indicates that, in year 1, the company had $3.00 in current assets for every $1.00 of current liabilities. In the second year, the company had $4.00 of current assets for every $1.00 of current liabilities. The average current ratio for the industry is 2.42. The good news is that The College Shop should have no trouble meeting its current obligations. The bad news is that, ironically, its current ratio might be too high: companies should have enough liquid assets on hand to meet current obligations, but not too many. Holding excess cash can be costly when there are alternative uses for it, such as paying down loans or buying assets that can generate revenue. Perhaps The College Shop should reduce its current assets by using some of its cash to pay a portion of its debt.
Debt-to-Equity Ratio
Now let’s look at the way The College Shop is financed. The debt-to-equity ratio (also called debt ratio) examines the riskiness of a company’s capital structure—the relationship between funds acquired from creditors (debt) and funds invested by owners (equity):
[latex]Total\;debt\;to\;equity=\frac{Total\;liabilities}{Total\;equity}[/latex]
[latex]Year\;1:\frac{\$180,000}{\$180,000}=1[/latex]
[latex]Year\;2:\frac{\$170,000}{\$198,000}=0.86[/latex]
In year 1, the ratio of 1 indicates that The College Shop has an equal amount of equity and debt (for every $1.00 of equity, it has $1.00 of debt). But this proportion changes in year 2, when the company has more equity than debt: for every $1.00 of equity, it now has $0.85 in debt. How does this ratio compare to that of the industry? The College Shop, it seems, is heavy on the debt side: the industry average of 0.49 indicates that, on average, companies in the industry have only $0.49 of debt for every $1.00 of equity. Its high debt-to-equity ratio might make it hard for The College Shop to borrow more money in the future.
How much difference can this problem make to a business when it needs funding? Consider the following example. Say that you have two friends, both of whom want to borrow money from you. You’ve decided to loan money to only one of them. Both are equally responsible, but you happen to know that one has only $100 in the bank and owes $1,000. The other also has $100 in the bank but owes only $50. To which one would you lend money? The first has a debt-to-equity ratio of 10 ($1,000 debt to $100 equity) and the second a ratio of 0.50 ($50 debt to $100 equity). You—like a banker—will probably lend money to the friend with the better debt-to-equity ratio, even though the other one needs the money more.
It’s possible, however, for a company to make its interest payments comfortably even though it has a high debt-to-equity ratio. Thus, it’s helpful to compute the interest coverage ratio, which measures the number of times that a firm’s operating income can cover its interest expense. We compute this ratio by examining the relationship between interest expense and operating income. A high-interest coverage ratio indicates that a company can easily make its interest payments; a low ratio suggests trouble. Here are the interest coverage ratios for The College Shop:
[latex]Interest\;coverage=\frac{Operating\;income}{Interest\;expense}[/latex]
[latex]Year\;1:\frac{\$50,000}{\$10,000}=5times[/latex]
[latex]Year\;2:\frac{\$33,000}{\$10,000}=3.3times[/latex]
As the company’s income went down, so did its interest coverage (which isn’t good). But the real problem surfaces when you compare the firm’s interest coverage with that of its industry, which is much higher—14.5. This figure means that companies in the industry have, on average, $14.50 in operating income to cover each $1.00 of interest that it must pay. Unfortunately, The College Shop has only $3.30.
Again, consider an example on a more personal level. Let’s say that following graduation, you have a regular interest payment due on some student loans. If you get a fairly low-paying job and your income is only 3 times the amount of your interest payment, you’ll have trouble making your payments. If, on the other hand, you land a great job and your income is 15 times the amount of your interest payments, you can cover them much more comfortably.
What Have the Ratios Told Us?
So, what have we learned about the performance of The College Shop? What do we foresee for the company in the future? To answer this question, let’s identify some of the basic things that every businessperson needs to do in order to achieve success:
- Make a good profit on each item you sell.
- Move inventory: the faster you sell inventory, the more money you make.
- Provide yourself and others with a good return on investment: make investing in your business worthwhile.
- Watch your cash: if you run out of cash and can’t pay your bills, you’re out of business.
The ratios that we’ve computed in this section allow us to evaluate The College Shop on each of these dimensions, and here’s what we found:
- Profit margin ratios (gross profit margin and net profit margin) indicate that the company makes a reasonable profit on its sales, though profitability is declining.
- One management efficiency ratio (inventory turnover) suggests that inventory is moving quickly, though the rate of turnover is slowing.
- One management effectiveness ratio (return on assets) tells us that the company generated an excellent return on its assets in its first year and a good return in its second year. But again, the trend is downward.
- Financial condition ratios (current ratio, total debt-to-equity, and interest coverage) paint a picture of a company heading for financial trouble. While meeting current bills is not presently a problem, the company has too much debt and isn’t earning enough money to make its interest payments comfortably. Moreover, repayment of a big loan in a few years will put a cash strain on the company.
What, then, does the future hold for The College Shop? It depends. If the company returns to year-1 levels of gross margin (when it made $0.45 on each $1.00 of sales), and if it can increase its sales volume, it might generate enough cash to reduce its long-term debt. But if the second-year decline in profitability continues, it will run into financial difficulty in the next few years. It could even be forced out of business when the bank demands payment on its long-term loan.
Key Takeaways
- Two common techniques for evaluating a company’s financial performance are vertical percentage analysis and ratio analysis.
- Vertical percentage analysis reveals the relationship of each item on the income statement to a specified base—generally sales—by expressing each item as a percentage of that base.
- The percentages help you to analyze changes in the income statement items over time.
- Ratios show the relationship of one number to another number—for example, gross profit to sales or net profit to total assets.
- Ratio analysis is used to assess a company’s performance and financial condition over time and to compare one company to similar companies or to an overall industry.
- Ratios can be divided into four categories: profit margin ratios, management efficiency ratios, management effectiveness ratios, and debt-to-equity ratios.
-
Profit margin ratios show how much of each sales dollar is left after certain costs are covered.
- Two common profitability ratios are the gross profit margin (which shows how much of each sales dollar remains after paying for the goods sold) and net profit margin (which shows how much of each sales dollar remains after all costs are covered).
-
Management efficiency ratios tell you how efficiently your assets are being managed.
- One of the ratios in this category—inventory turnover—measures a firm’s efficiency in selling its inventory by looking at the relationship between sales and inventory.
-
Management effectiveness ratios tell you how effective management is at running the business and measure overall company performance by comparing net profit to some measure of the amount of capital used in the business.
- The return on assets ratio, for instance, compares net profit to total assets to determine whether the company generated a reasonable profit on the assets invested in it.
- Financial condition ratios are used to assess a firm’s financial strength.
- The current ratio (which compares current assets to current liabilities) provides a measure of a company’s ability to meet current liabilities.
- The debt-to-equity ratio examines the riskiness of a company’s capital structure by looking at the amount of debt that it has relative to total equity.
- Finally, the interest coverage ratio (which measures the number of times a firm’s operating income can cover its interest expense) assesses a company’s ability to make interest payments on outstanding debt.
Exercises
-
(AACSB) Analysis
The accountant for my company just ran into my office and told me that our gross profit margin increased while our net profit margin decreased. She also reported that while our debt-to-equity ratio increased, our interest coverage ratio decreased. She was puzzled by the apparent inconsistencies. Help her out by providing possible explanations for the behavior of these ratios.
- Which company is more likely to have the higher inventory turnover ratio: a grocery store or an automobile manufacturer? Give an explanation for your answer.
References
Another way to calculate inventory turnover is to divide Cost of goods sold by inventory (rather than dividing Sales by inventory). We don’t discuss this method here because the available industry data used for comparative purposes reflect Sales rather than Cost of goods sold.
