11.2 Data, Information, and Knowledge
Learning Objectives
After studying this section you should be able to do the following:
- Understand the difference between data and information.
- Know the key terms and technologies associated with data organization and management.
Data refers simply to raw facts and figures. Alone it tells you nothing. The real goal is to turn data into information. Data becomes information when it’s presented in a context so that it can answer a question or support decision making. And it’s when this information can be combined with a manager’s knowledge—their insight from experience and expertise—that stronger decisions can be made.
Trusting Your Data
The ability to look critically at data and assess its validity is a vital managerial skill. When decision makers are presented with wrong data, the results can be disastrous. And these problems can get amplified if bad data is fed to automated systems. As an example, look at the series of man-made and computer-triggered events that brought about a billion-dollar collapse in United Airlines stock.
In the wee hours one Sunday morning in September 2008, a single reader browsing back stories on the Orlando Sentinel’s Web site viewed a 2002 article on the bankruptcy of United Airlines (UAL went bankrupt in 2002, but emerged from bankruptcy four years later). That lone Web surfer’s access of this story during such a low-traffic time was enough for the Sentinel’s Web server to briefly list the article as one of the paper’s “most popular.” Google crawled the site and picked up this “popular” news item, feeding it into Google News.
Early that morning, a worker in a Florida investment firm came across the Google-fed story, assumed United had yet again filed for bankruptcy, then posted a summary on Bloomberg. Investors scanning Bloomberg jumped on what looked like a reputable early warning of another United bankruptcy, dumping UAL stock. Blame the computers again—the rapid plunge from these early trades caused automatic sell systems to kick in (event-triggered, computer-automated trading is responsible for about 30 percent of all stock trades). Once the machines took over, UAL dropped like a rock, falling from twelve to three dollars. That drop represented the vanishing of $1 billion in wealth, and all this because no one checked the date on a news story. Welcome to the new world of paying attention (Harvey, 2008)!
Understanding How Data Is Organized: Key Terms and Technologies
A database is simply a list (or more likely, several related lists) of data. Most organizations have several databases—perhaps even hundreds or thousands. And these various databases might be focused on any combination of functional areas (sales, product returns, inventory, payroll), geographical regions, or business units. Firms often create specialized databases for recording transactions, as well as databases that aggregate data from multiple sources in order to support reporting and analysis.
Databases are created, maintained, and manipulated using programs called database management systems (DBMS), sometimes referred to as database software. DBMS products vary widely in scale and capabilities. They include the single-user, desktop versions of Microsoft Access or Filemaker Pro, Web-based offerings like Intuit QuickBase, and industrial strength products from Oracle, IBM (DB2), Sybase, Microsoft (SQL Server), and others. Oracle is the world’s largest database software vendor, and database software has meant big bucks for Oracle cofounder and CEO Larry Ellison. Ellison perennially ranks in the Top 10 of the Forbes 400 list of wealthiest Americans.
The acronym SQL (often pronounced sequel) also shows up a lot when talking about databases. Structured query language (SQL) is by far the most common language for creating and manipulating databases. You’ll find variants of SQL inhabiting everything from lowly desktop software, to high-powered enterprise products. Microsoft’s high-end database is even called SQL Server. And of course there’s also the open source MySQL (whose stewardship now sits with Oracle as part of the firm’s purchase of Sun Microsystems). Given this popularity, if you’re going to learn one language for database use, SQL’s a pretty good choice. And for a little inspiration, visit Monster.com or another job site and search for jobs mentioning SQL. You’ll find page after page of listings, suggesting that while database systems have been good for Ellison, learning more about them might be pretty good for you, too.
Even if you don’t become a database programmer or database administrator (DBA), you’re almost surely going to be called upon to dive in and use a database. You may even be asked to help identify your firm’s data requirements. It’s quite common for nontech employees to work on development teams with technical staff, defining business problems, outlining processes, setting requirements, and determining the kinds of data the firm will need to leverage. Database systems are powerful stuff, and can’t be avoided, so a bit of understanding will serve you well.
Figure 11.1 A Simplified Relational Database for a University Course Registration System
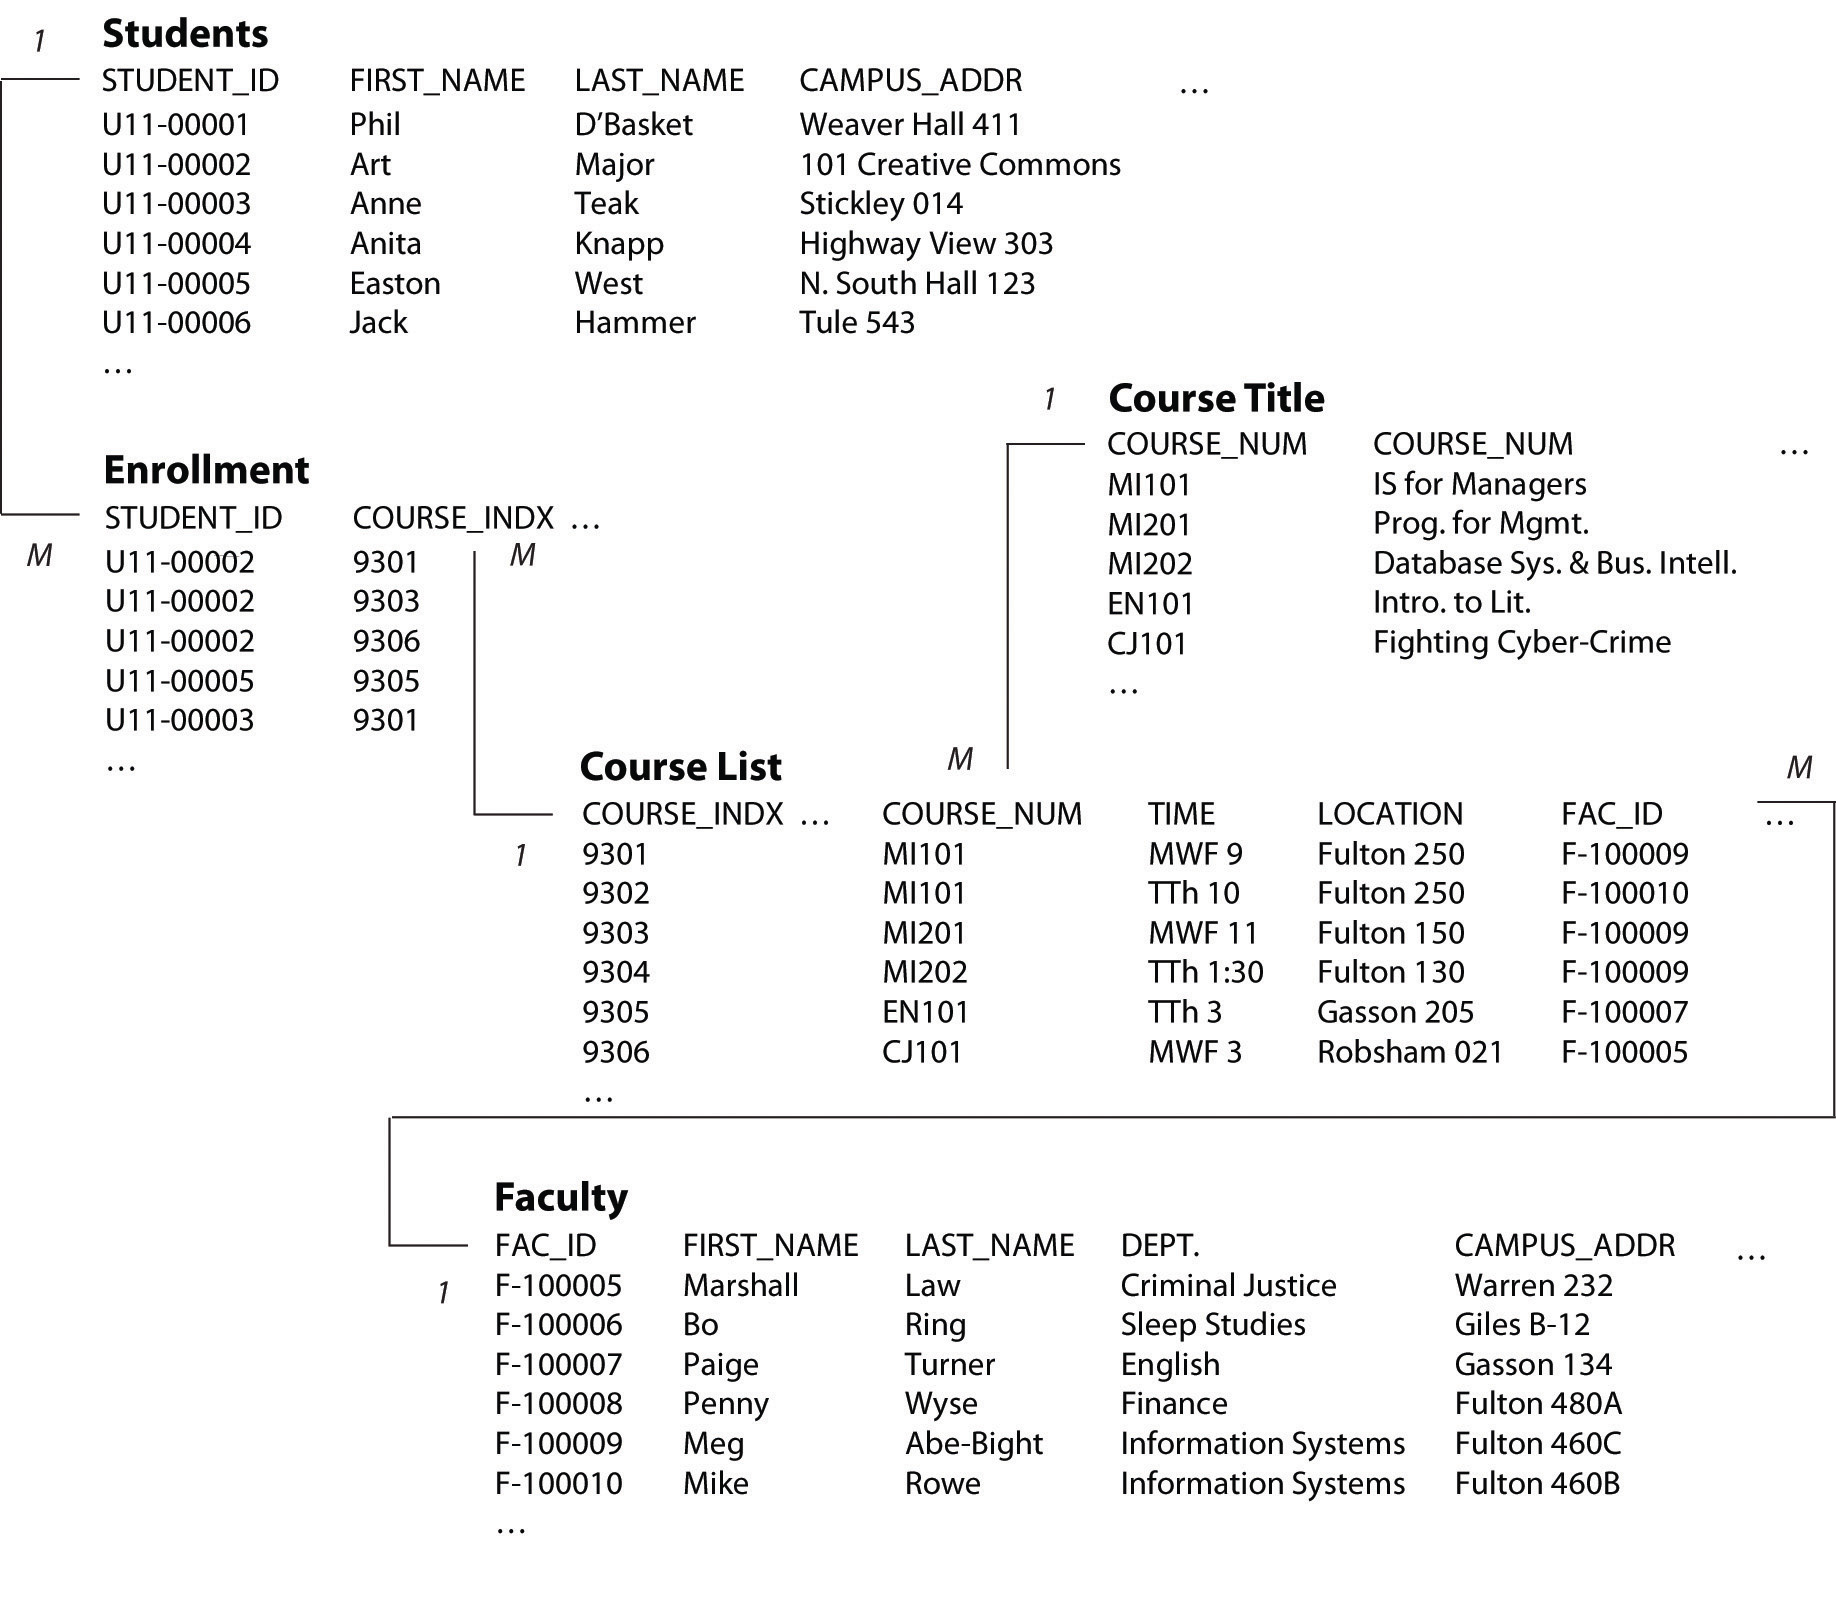
A complete discourse on technical concepts associated with database systems is beyond the scope of our managerial introduction, but here are some key concepts to help get you oriented, and that all managers should know.
- A table or file refers to a list of data.
- A database is either a single table or a collection of related tables. The course registration database above depicts five tables.
- A column or field defines the data that a table can hold. The “Students” table above shows columns for STUDENT_ID, FIRST_NAME, LAST_NAME, CAMPU.S._ADDR (the “…” symbols above are meant to indicate that in practice there may be more columns or rows than are shown in this simplified diagram).
- A row or record represents a single instance of whatever the table keeps track of. In the example above, each row of the “Students” table represents a student, each row of the “Enrollment” table represents the enrollment of a student in a particular course, and each row of the “Course List” represents a given section of each course offered by the University.
- A key is the field used to relate tables in a database. Look at how the STUDENT_ID key is used above. There is one unique STUDENT_ID for each student, but the STUDENT_ID may appear many times in the “Enrollment” table, indicating that each student may be enrolled in many classes. The “1” and “M” in the diagram above indicate the one to many relationships among the keys in these tables.
Databases organized like the one above, where multiple tables are related based on common keys, are referred to as relational databases. There are many other database formats (sporting names like hierarchical, and object-oriented), but relational databases are far and away the most popular. And all SQL databases are relational databases.
We’ve just scratched the surface for a very basic introduction. Expect that a formal class in database systems will offer you far more detail and better design principles than are conveyed in the elementary example above. But you’re already well on your way!
Key Takeaways
- Data includes raw facts that must be turned into information in order to be useful and valuable.
- Databases are created, maintained, and manipulated using programs called database management systems (DBMS), sometimes referred to as database software.
- All data fields in the same database have unique names, several data fields make up a data record, multiple data records make up a table or data file, and one or more tables or data files make up a database.
- Relational databases are the most common database format.
Questions and Exercises
- Define the following terms: table, record, field. Provide another name for each term along with your definition.
-
Answer the following questions using the course registration database system, diagramed above:
- Imagine you also want to keep track of student majors. How would you do this? Would you modify an existing table? Would you add new tables? Why or why not?
- Why do you suppose the system needs a “Course Title” table?
- This database is simplified for our brief introduction. What additional data would you need to keep track of if this were a real course registration system? What changes would you make in the database above to account for these needs?
- Research to find additional examples of organizations that made bad decisions based on bad data. Report your examples to your class. What was the end result of the examples you’re citing (e.g., loss, damage, or other outcome)? What could managers have done to prevent problems in the cases that you cited? What role did technology play in the examples that you cite? What role did people or procedural issues play?
- Why is an understanding of database terms and technologies important, even for nontechnical managers and staff? Consider factors associated with both system use and system development. What other skills, beyond technology, may be important when engaged in data-driven decision making?
References
Harvey, M., “Probe into How Google Mix-Up Caused $1 Billion Run on United,” Times Online, September 12, 2008, http://technology.timesonline.co.uk/tol/news/tech_and_web/article4742147.ece.
