Chapter 3: Differences Within and Across Familes’ Technology Use
3.1 Differences Within and Across Families’ Technology Use
One can state, without exaggeration, that the observation of and the search for similarities and differences are the basis of all human knowledge.
― Alfred Nobel
Chapter Insights
- Differences lie within individuals in families, and in families as a whole. These differences, more than anything, illustrate the complexity in characterizing technology use within and across families. They also reveal issues of underlying equity and social justice, and of families and technology.
- “Use” is a widely variable term. It can be operationalized to represent which device and application, for what purpose, for how long, in which way, with whom, and where. To compare “use” effectively is to identify the standard for the definition and measure first.
- Functional differences in technology use may be seen by individuals within the family and by subsets of family members. How siblings use applications together may be far different than how a child uses the application with a parent. These functional differences may represent differences in family dynamics, structure, and roles.
- Family member and whole family variation in technology use depends on their attitudes toward technology and on comfort, skill, and access. Access can vary by geography, economics, education, language, and ability. Situations putting strain on families, such as COVID-19, immigration, or other separations, can reveal access needs that present serious gaps. Attitude, comfort and skill, and digital readiness are directly related to access.
- Ensuring access to technology — specifically, internet service, cellphone service, and accommodations for ease in using technology — is a question that has policy and political implications. Whose responsibility is it to ensure internet access?
- After reading this chapter, identify what you feel inspired by, the questions that remain for you, and the steps you can take for your own technology use to be more intentional.
Introduction
During the COVID-19 pandemic, headlines brought attention to disparities in children’s academic achievements due to differences in their ability to keep up with school online (Dorn et al., 2021). With remote learning, which depended on children having access to computers and internet in the home, children across the globe who lacked internet access or had limited and shared access to technology struggled to keep up. More recently, the news has highlighted the challenges faced by families fleeing Ukraine during the Russian conflict. For them, having a smartphone with data meant staying connected and accessing resources; in other words, it was truly a lifeline (Cantrill, 2022). It’s difficult to imagine navigating the challenges faced by refugees without being able to call or access the internet.
All families vary by their preferences, functional needs for technologies, habits, and behaviors with media. Specific families face issues with access: a family in a rural area without a high-speed connection or with few cell phone towers can face delays in getting valuable health information or doing business. These modern-day examples highlight differences among families with regard to technology access and use. Even among families in less extreme conditions, differences exist that can mean significant divides. A family in a rural area without a high-speed connection or with few cell phone towers can face delays in getting valuable health information or doing business. Families also vary by their preferences, functional needs for technologies, habits, and behaviors with media. The Federal Communications Commission identifies household differences by light, moderate, and high internet use based on current use of one, two, three, or four devices at a time.
Families also vary within their membership, as individuals demonstrate functional behavioral, attitudinal, and skill differences in the daily use of ICT. If you read that “smartphones are owned by 85% of families in the U.S.,” what would you want to know? Which U.S. families? The majority of all families? The majority of white, middle-class families? Even a sample indicating “representativeness in the U.S.” would need clarification. You might want to know if a family is defined by biological and immediate family, contains extended families, or includes those not directly related. And you might question this statistic based on families’ habits or access to technology.
For family professionals, awareness of these differences can be key to understanding family conflict, communication, and flexibility. It may also direct attention to technology access as an issue for families, when attention might be on school performance or employment. This chapter examines technology use in the family to see how it may differ within families (e.g., in ways that might have an impact on relationships and systemic family functioning), and across families (e.g., how family variation might indicate differences in family well-being by virtue of use or access).
Family Differences
 |
 |
No two families are alike, and no two families use technology in the same ways. As discussed in the last chapter, families can be defined by structure, composition, or membership — varying by number, member age, member roles and responsibilities (e.g., two parents, one parent, a grandparent), number of children, and subsystems (e.g., parent + oldest child, father and father). As discussed throughout this book, these differences will reflect the ways in which technology is used by individuals and with family members as well. Families with several children in the preteen and teenage years may have multiple phones; a single parent with an infant would not. As the family is an open system, each is differently influenced by social, belief, and extended family systems (Olson, et al, 2014). These systems may influence their practices, knowledge, value, and needs for using technology.
Families with close connections to extended members (e.g., cousins and grandparents across the country or the world) may include videoconferencing through apps like FaceTime as a nightly practice or regularly text through WhatsApp. Smaller families with all members living in the same household would not. And families vary by demographics, education, household income, language, and geographic location. As a student, you may have experienced how your level or exposure to formal education can influence interactions with settings that integrate technology in learning. Over time, this might influence your skill and comfort. Geographic location can affect access to the internet and to social and practical resources that encourage use.

A note of caution as we proceed. As we examine family technology use, we need to distinguish research that uses data from families from research that uses data on “households.” While households often include families, this isn’t always the case. For example, a U.S. government report on internet broadband access and smartphone ownership may say it describes U.S. “families.” Closer inspection, however, reveals that the data was taken from U.S. households. The U.S. Census Bureau defines a household as all people who occupy a single housing unit, regardless of their relationship to one another (Population Reference Bureau, 2020). Can we say that this represents “families”? Households may include biological or legal families, but may also contain a group of adults living together or several families. And as you cross continents, a demographer’s definition of “family” or “household” might vary depending on government or bureaucratic definitions. Similarly, research claiming to explore “family” technology practice or impacts requires careful attention to the true population of interest. A single-parent family is different from a family with one child under the age of 18, which is different from a blended family of two homosexual parents of six children ranging from birth through age 18, which is different from an Asian-American family comprised of first-, second-, and third-generation members.
As we discuss technologies used by families , it’s important that we have a clear understanding of what is meant by family, technology, and technology use. With these standards understood, we can explore why differences within and across families matter.
Measurement of Technology Use
Variation in “use” definitions.
Consider your own family once again. If you were asked to observe ICT use by its members over a typical day, what would you look for? Which type of tech your family members use? Which applications they are on, for how long? How your parents’ use for work seems focused on their laptops while your little brother’s time spent gaming is on his phone? Operationalizing the construct of technology use is important, as the term is general and can mean many things. As a result, researchers measure it differently. In Gottschalk’s discussion of videogames in her review on children and technology use impacts, she cites research that assess use as frequency, while another looks at use as the type of game played, and deployment of touch screen technology. Some studies assess use very broadly. In Hamilton’s study on children’s use in Jamaica (2010), use or consumption is a single item: “Frequency of individual use of the Internet in the last 12 months (from any location)” along with many indicators of technology possession. Reflect on your own “use” in the last few hours. What are the many ways in which a researcher might categorize your practice?
A few examples:
- Device ownership: which, how many, how many per person/per family, which model, how many different devices?
- Functions: what is the device or app used for? The function may be refined more specifically, say to indicate parenting behavior: communication with children, number of times reassuring texts are sent to a child, and so on.
- How is technology used to accomplish a purpose? Which purpose? For what benefit or consequence?
- Use behavior: device or application frequency (minutes per day, hours per day, days, interaction events, times the screen is touched, times the phone is picked up
- Use by an individual (to benefit the individual)? Use as shared?
- Where is the device or application used?
- Device application “problem” (e.g., addiction, being a tech Luddite?) or identity affiliation (e.g., feminist expression, Goh, 2013)
Another common oversight is when researchers report “use,” but are really measuring device ownership or application membership. Just because your dad has an Apple iPod Nano he bought in 2005 doesn’t mean that he uses it. Or you were “gifted” with a device (thus ownership), but you rarely pick it up. A related concept is “membership.” Social media applications abound. People download them, and create accounts. But use is not equivalent to membership or having an account. In the graphic below, Twitter users make posts in varying frequencies (McClain et al., 2021). Just under half (49%) post fewer than five tweets a month, while just over half (52%) report posting daily (https://backlinko.com/twitter-users#twitter-users), and the majority of Twitter content is contributed by only 25% of users. Yet Twitter can boast that it has 400 million accounts. Clearly, there are differences between those holding accounts and those who are active users. Preferences and behavior vary. Determining what the researcher means by “use” is as critically important as determining your definition and interest in family. Without doing so, it will be difficult to aggregate research findings for a clear assessment of “use.”
Keep an eye out for advanced methodologies and definitions of “use” as research into the impact of technology on the family continues. Innovative projects such as the Human Screenome Project, for instance, collect rich data from screen captures from individuals’ phones, revealing possibilities for interpreting the interplay between technology-integrated interest and interaction (Reeves, et al., 2019). The implications from this data in better understanding family system and subsystem dynamics are endless.
Definitions of devices, applications, and power
Depending on the individual, the generic term “technology,” or even “information and communications technology” can mean a particular device, or an application or software on the device. A good place to begin with specificity on use is to define precisely what is meant by “technology” devices, applications, or even the internet, when they are included in measurement.
According to Wikipedia, digital media is
any communication media that operate with the use of any of various encoded machine-readable data formats. Digital media can be created, viewed, distributed, modified, listened to, and preserved on a digital electronics device. Digital can be defined as any data represented by a series of digits, while media refers to methods of broadcasting or communicating this information. Together, digital media refers to mediums of digitized information broadcast to us through a screen and/or a speaker.
This also includes text, audio, video, and graphics that are transmitted over the internet for viewing or listening to on the internet. Digital media platforms, such as YouTube, Vimeo, and Twitch, accounted for viewership rates of 27.9 billion hours in 2020.
Social media, on the other hand, is a more specific term. It refers to “interactive technologies and digital channels that facilitate the creation and sharing of information, ideas, interests, and other forms of expression through virtual communities and networks. It has some common features:
- Social media are interactive, Web 2.0 Internet-based applications.
- User-generated content — such as text posts or comments, digital photos or videos, and data generated through all online interactions — is the lifeblood of social media.
- Users create service-specific profiles for the website or apps that are designed and maintained by the social media organization.
- Social media helps the development of online social networks by connecting a user’s profile with those of other individuals or groups.
As of January 2022 (Statista), the top three social media services, based on having more than 200 million users each, were Facebook, YouTube and WhatsApp.
Powering use
Just as “electricity” can be considered the power that enables us to watch television, or “gasoline” the thing that currently powers our cars, the internet can be seen as what “powers” our ability to use applications and devices. Wikipedia describes the Internet (or internet) as
the global system of interconnected computer networks that uses the Internet protocol suite (TCP/IP) to communicate between networks and devices. It is a network of networks that consists of private, public, academic, business, and government networks of local to global scope, linked by a broad array of electronic, wireless, and optical networking technologies. The Internet carries a vast range of information resources and services, such as the inter-linked hypertext documents and applications of the World Wide Web (WWW), electronic mail, telephony, and file sharing.
Unless we are using an application “off line” or have “downloaded” a file, much of our use of social media, search sites like Google or DuckDuckGo, videoconferencing on FaceTime, and learning management systems like Blackboard is dependent on our device’s connection to the internet.
A cellular or mobile network (for texting and calls) is “a communication network where the link to and from end nodes is wireless. The network is distributed over land areas called ‘cells,’ each served by at least one fixed-location transceiver (typically three cell sites or base transceiver stations). These base stations provide the cell with network coverage which can be used for transmission of voice, data, and other types of content…. When joined together, these cells provide radio coverage over a wide geographic area” (Wikipedia).
A peripheral is “an auxiliary device used to put information into and get information out of a computer.The term peripheral device refers to all hardware components that are attached to a computer and are controlled by the computer system, but they are not the core components of the computer, such as the CPU or power supply unit” (Wikipedia). Input devices include mice, keyboards, graphic scanners, and microphones. Output devices include monitors, printers, headphones, and speakers. Input/output devices also include external hard drives.
Devices

Portable devices used to perform “information” and “communications” functions include small, handheld machines like cellular (mobile) phones and smartphones — portable devices that combine mobile telephone and computing functions into one unit. Look at your smartphone. What are all the functions that it performs? At the very least you can use it as a calculator, and to make calls, take pictures and videos, and send emails and text messages. Later in the chapter, we’ll discuss differences in access to the internet and to devices like cell phones. Many of these differences fall along demographic lines.
Applications, or Software
During the day we often check our Instagram accounts, or open a file on a document production program like Word. Though we are “on our phone” or “on the laptop,” we’re technically using a specific application or piece of software on that device. According to Wikipedia,
an application program (application or app for short) is a computer program designed to carry out a specific task other than one relating to the operation of the computer itself, typically to be used by end-users. Word processors, media players, and accounting software are examples, and the collective noun refers to all applications collectively. The other principal classifications of software are system software, relating to the operation of the computer, and utility software (‘utilities). Applications may be bundled with the computer and its system software or published separately and may be coded as proprietary, open-source, or projects. The term “app” often refers to applications for mobile devices such as phones.
In technical papers (including reports for a course), we refer to our reliance on particular applications. Because these are intellectual properties, often with trademarks and copyrights, it is important to remember to capitalize them (e.g., Instagram, Facebook, TikTok). This is particularly important as some applications like Canvas (learning management software) are also nouns in the English language that would not be caught in spell checking programs.
Functional Differences in Use
Now that we have some basic terminology for technology, we can consider the various functions technology performs as they may relate to an individual’s or family’s purpose.
- Communication: between couples, parent and child, parents and co-parents, extended family (grandparents). Who, how, with what frequency, and which device for which family member.
- Connectivity: How is this different? What is social networking? What is the value of social networking in family life?
- Information gathering (informal learning): for parenting, decision-making, problem-solving. By whom (e.g., parents, adult children)? On what topics? Using what means? On the internet (info searches)? From others (discussion boards, social media)?
- Entertainment: couple and family time together via gaming, co-viewing media. Most parents monitor the content of the videogames that children play.
- Utilities: banking, health care, travel and transportation, taxes, housing, food, navigation.
- Use of tech outside the family that affects the family: work, school (formal learning by young children, older children), use of technology devices in the family system (parents as learning heroes).
These functions apply to most anyone using technology; they are not unique to the family. Families who play online and videogames together, for example, find it a great way to spend time together. Parents report playing videogames with their children because it’s fun, it’s a good opportunity to socialize with their child, their child asks them to, they can monitor what children are playing and thus exposed to, and they enjoy it (ESRB, 2022). Ninety-four percent of parents pay attention to the videogames played by their children, 71% say videogames have a positive influence on their child’s life, 67% play videogames with their children at least once weekly.
Yet when we view these activities in terms of of fulfilling family roles and the development of individuals within a family, their use can be distinguished from individual, group, or societal use distinct from the family. A function unique to the family is the fulfillment of family roles — parenting, caregiving (direct action and indirect fulfillment), and relationship initiation, maintenance, or possible dissolution. This final function distinguishes technology used by families from others, in so far as use has direct or indirect benefits to family members or the family as a whole.
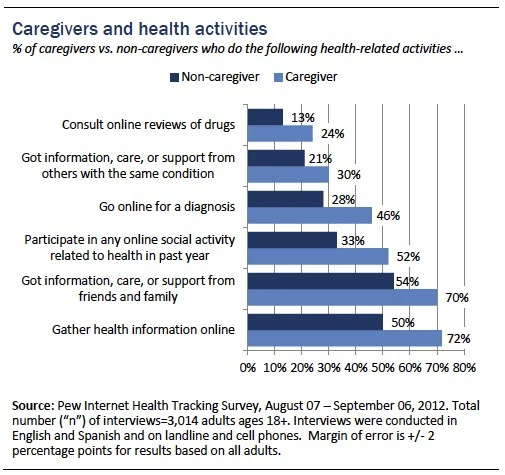
For example, while Facebook use as a means for social networking has long been a focus for research (e.g., Zhuravskaya, et al., 2020), a study on the transition to parenthood finds its role valuable in creating new network members and resources for social support (Bartholomew, et al,. 2012). As illustrated below, those fulfilling caregiving roles in families demonstrate different information search behaviors than non-caregivers (Fox & Duggan, 2013). The same report indicates that one in three caregivers are likely to use health “trackers” through technology to monitor the health of the person they are caring for.
Yet, naturally, caregiving in families is most considered parenting or childrearing, and chapters 5, 6, and 7 explore the role technology plays in these family roles as distinct from adult-only technology use.
As an example of distinguishing adult technology use from use that holds specific value to the family, in our early work (around 2008) studying parents’ technology use — as parents in the parenting role — it was essential to add specific functions of the parenting role to identify how ICT was used (e.g., Walker, et al., 2011; Walker & Rudi, 2014). It was impossible to extrapolate from information about “adults” in extant research. as not all adults are parents, and adult roles and functions can include tasks that don’t include childrearing. Our study needed to add items specific to the parenting role (e.g., “monitor who my child interacts with” or “validate my observations as a parent.”)
Further analysis of family use of technology to fulfill family functions might consider different configurations of which family members are using technology with others. Differences might exist, for example, between parents, co-parents in divorce and separation, parents and children, siblings, family and grandparents, grandchild and grandparent, foster parent and foster child. Such configurations are limited only by the variations of family membership and structure. Thinking of your own family, identify examples of family members’ use of technology might fulfill family functions.
Here are examples from my family. There are three of us, my husband, my 28-year-old daughter (who lives in another state), and myself.
- I text my daughter good morning (parental nurturance; relationship maintenance).
- She Venmos a request for repayment of my plane ticket (practical assistance between family members).
- I may use FaceTime to talk with her during a weekend day as she works on her taxes (family communication, parental assistance in problem-solving, parental guidance to an emerging adult on learning a life skill of adulthood).
- I search Google Flights to find available, low-cost airfares for the wedding of an extended family member (family connectedness).
In each way I use technology, I fulfill my role in the family as parent and family member. Each action could be measured for use by any adult — searching for a flight, talking to others through FaceTime, requesting money. Yet each action can be defined as it relates to a family role and to relationships and family outcomes.
Factors influencing use
Technology attitudes, comfort and skills.
To further understand differences in use is to be aware of external factors that influence use: comfort and skills in using technology (conditioned by a number of factors) and access. Davis’ Technology Acceptance Model (1989), discussed in the previous chapter, identifies use as conditioned by attitudes of acceptance, which are influenced by the perception that a technology is easy to use and is useful. Context research supports the idea that external conditions, including resources and encouragement, can make a difference in the motivation to use technology and acquire skills. Technology use varies as well by the individual’s attitude, skill, and comfort.
Consider the people in your life. Are some “techy” and capable of picking up any kind of device or system, while others need assistance when something new is suggested? Do some love using technology and feel a bit addicted to applications, like gaming, while others are suspicious of tech’s influence and use it sparingly or only out of necessity? Now consider how these differences in skill and attitude might affect use. The friend who feels very comfortable with technology will probably use it more, while the one whose skill level is low and/or who worries about its negative effects will use it far less.
In some studies, attitudes toward technology use are a proxy for actual behavior. In behavioral intention models in psychology, feelings about an activity and an intention to do the activity are demonstrated to relate to the actual behavior. Technology acceptance measures attitudes that are favorable or open to the value of technology in one’s life or work. These may be measured through statements like the following, with each rated on a scale of 1 (strongly disagree) to 7 (strongly agree) (adapted from Teo et al., 2017):
- Technology makes work more interesting
- Working with technology is fun
- I like using technology
- I look forward to those aspects of my job that require me to use technology
While these items don’t indicate how a technology is used, as a cluster of items or construct they can indicate favorability toward use, and serve as a point to which factors of influence can compare, such as whether the individual perceives technology to be easy to use (“I find it easy to get technology to do what I want it to do”) and/or if the individual perceives value in using a particular technology (“Using technology will increase my productivity” or “I find technology is a useful tool in my work”). In research with family educators and family professionals, we determined that ease of use and value had a direct bearing on attitudes of technology acceptance (Walker et al., 2021). Other factors related to skill and comfort lie with exposure to external resources and supports, such as technical training and being surrounded by others who value technology.
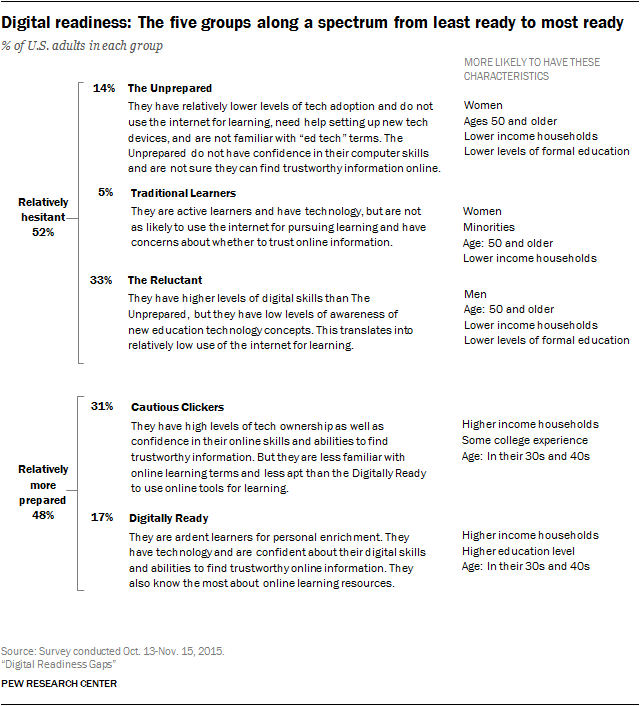
In 2021, Pew Internet determined that about one-third of adults in the U.S. can be characterized as having “Lower tech readiness” (Vogels et al., 2020). Those who demonstrated lower ‘tech readiness’ are people who are not at all or only a little confident using their digital devices to do the things they need to do online, or usually need someone else to set up or show them how to use new devices. Tech readiness aligns along demographic lines. Older Americans, for example, are more likely to demonstrate lower tech readiness, as are those with less income or education. Yet attitude may co-exist with tech readiness skills. In the same research, the share of Americans with lower tech readiness who say the internet has been essential to them is 27 percentage points lower than for those with higher tech readiness. They too are more likely to use older applications, such as email or calling by phone, rather than videoconferencing or text messaging. And readiness has indirect effects. During the pandemic, 47% of parents with less digital readiness reported difficulty in helping their children with remote learning, compared with 24% of higher readiness parents.
These results mirror earlier research by Pew revealing digital readiness characteristics that correlated with other demographic indicators (2015):
Access
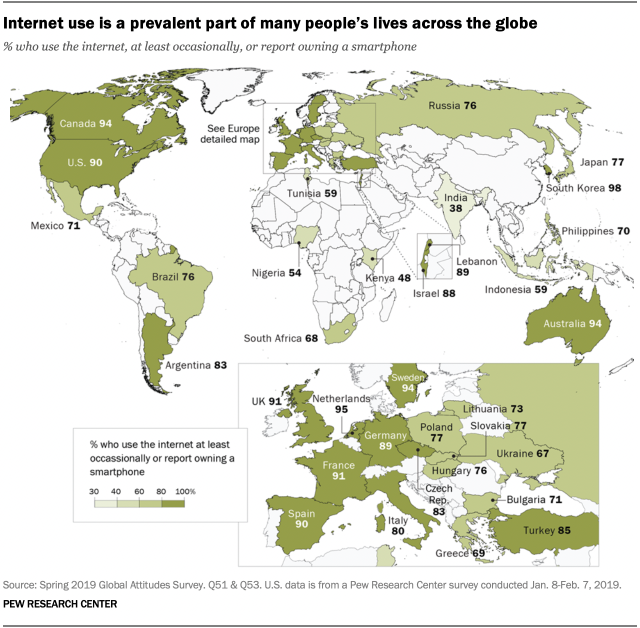
While internet access seems ubiquitous in our modern society, it is not guaranteed. Global data indicate that, on average, at least 77% of the world’s population has at least some access to the internet (Schumacher & Kent, 2020) (figure x below). Countries and regions with more advanced economies report higher rates of use (close to 87%): Australia, Canada, South Korea, the Netherlands, Europe, the Americas, and the Commonwealth of Independent States (CIS) (ITU, 2019; Schumacher & Kent, 2020). Countries with emerging economies report lower use (47% on average), and those in the least-developed countries — primarily in Africa — report an average of 19%. Across Africa, averages range from 4.7% in Western Sahara to 87.2% in Kenya (Internet World Stats, 2020). The range in Latin America is similarly wide, with saturation high in countries like Argentina (92.2%) and Costa Rica (85.5%), and low in countries such as Nicaragua (30.2%) and Honduras (28.7%). Since 2015, overall access to the internet exceeds household computer ownership, with the ITU reporting that it is no longer necessary to have a computer at home to access the internet (2019, p. 7).
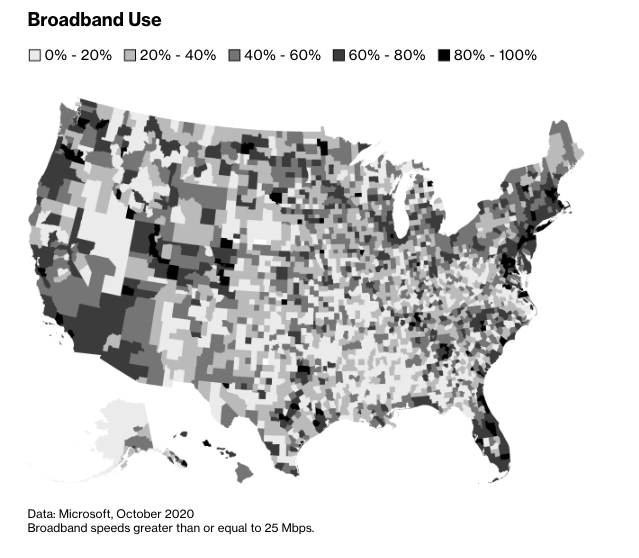
As illustrated by the map below, use of high-speed broadband is significantly lower in some areas of the U.S. compared to others. Similarly, cell phone ownership is higher in countries with developed economies (e.g., over 90% in European countries). Demographic factors such as younger age, higher household income, and education level are related to greater access and higher rates of internet and cell phone use.
Access differences affect the family’s ability to take full advantage of technological efficiencies and benefits.Access differences affect the family’s ability to take full advantage of technological efficiencies and benefits. Access is particularly critical when families are mobile or relocating due to immigration, living transnationally, or separated due to military service or employment. For families experiencing migration, having access to the internet is critical for communication with family members, efficient movement (e.g., documentation at border control), integration into new locations (e.g., finding employment, housing, services), using geolocation services, transferring money, and more (McAuliffe, 2021). Lack of access and and the lack of accommodation to the needs of immigrant family (e.g., translation of applications) affects comfort in using technology and acquisition of basic computer skills. Inequities lead to “knowledge gaps,” particularly in children, and to differences in the acquisition of technology skills needed for employment, settlement, and possible resettlement. For any family, but particularly for those who are vulnerable (such as during transnational living or immigration), gaps in access exacerbate challenges brought about by disparities in income, education, employment, housing and sanitary living conditions, and health care.
Scholars assert that equity will remain a prevalent issue for families in the future (Anderson, et al., 2021). While equity and internet access as human rights are macro-level policy issues, small-scale efforts get technology into the hands of families and children in need. Schools, for example, may distribute devices, routers, and wifi hubs; provide additional technology coaching; and train teachers to be sensitive to equity and access needs when integrating technology in coursework. In California, nearly one-third of school-age children lack access to broadband networks, and lack of access is nearly double for children of color compared to their White counterparts. In addition to the “quick fixes” of providing wifi hubs and internet access in public buildings, the “Broadband for California” bill, Senate Bill 1130, would make “funds for broadband accessible to all communities in the state and ensure that projects built with these funds are future-proof and have more open-access to our communities” (Gonzalez & Steyer, 2020). As this story from Arkansas illustrates, providing reliable broadband in remote communities is a significant challenge politically and practically (Carr, 2021), yet it is worth the effort. Faster connections can mean greater participation in school, family connectivity, employment, and the tasks of daily life for families. Those interested in progress in Minnesota may want to follow the Broadband Task Force of the Office of Broadband Development (https://mn.gov/deed/programs-services/broadband/task-force/).
Scholars assert that equity will remain a prevalent issue for families in the future….While equity and internet access as human rights are macro-level policy issues, small-scale efforts get technology into the hands of families in need. Beyond geography and economics, other demographic characteristics differentiate use and access. Younger individuals are far more likely to be on social media, use the internet, and own a smartphone. And educational attainment can vary use. With education level established by country, higher access is seen in those who have completed more schooling (Schumacher & Kent, 2020). Variations can be narrow, as in the case of South Korea, where educational level varies use by 4%. In Nigeria, however, a 60% difference occurs: 13% of those with limited education access the Internet, compared with 73% with more education. In every region of the world, to varying degrees, internet use is greater for men than women. Differences are smaller in more developed countries (e.g., 1–2%), but in developing and least-developed countries (LDCs), men’s access exceeds women’s by 10–12% (ITU, 2019). And the gap, as measured between 2013 and 2019, is growing — 7% in developing countries, and 15.9% in least-developing countries (ITU, 2019). Gender differences in mobile phone ownership also exist, mimicking those in internet access.
Questions of access must also consider ability: persons with disabilities may be need accommodation devices and software. And we can consider language: how many applications are available in the language that an individual reads, writes, and understands?
Differences in demographics, ability, and language do more than bifurcate our view of who does or does not use or have access to technology. They also reveal equity differences that affect the ability to take full advantage of technological efficiencies, access to information, connectivity, and interactivity for learning and employment. As noted, access is particularly critical when families are mobile, relocating due to immigration or being refugees, live transnationally, or are separated due to military service or employment (Carter & Renshaw, 2016; Karraker, 2015). During the pandemic, although focus was on family internet access to ensure children’s school participation, homeless families often fell through the cracks (Shapiro, 2020). Shelter wi-fi can be unreliable, and a school’s lack of devices to distribute to students may particularly affect homeless children whose household does not have devices of its own.
There appears to be a reciprocal relationship between access and comfort. The ITU reports that, in 40 of the 84 countries with available data, less than half of the population have basic computer skills (e.g., copying a file, sending an email with an attachment) and in 60 countries fewer than half report having standard skills (e.g., installing software). While lack of access and skills is referred to as the “digital divide,” others characterize the space by the deficits created: the “access gap” or the “knowledge gap” (Wei & Hindman, 2011). Geographic location can make a difference. Those living in more rural areas not only may lack access, but they may be unable to gain the digital skills necessary for work in the 21st century. Wood (2018) reports that large tech-based companies such as Amazon are moving toward exclusively operating in larger, urban cities, creating a further divide between urban and rural regions in technology training and skills. Blum-Ross and others (2018) suggest that varying levels of skills, literacy, and confidence with technology are a new way to understand family diversity.
As observed, the “digital readiness” spectrum runs from those who are unprepared to those who are digitally ready. Approximately half are unprepared, traditional learners, and/or reluctant. They tend to be older and in households with lower income and education. The other half are those more prepared, labeled the the “cautious clickers” and the “digitally ready.” These groups are younger and have higher incomes. Consider why these demographics of age, income, and education may relate to these attitudinal and skill differences. One possibility is that feelings of confidence and skill relate to access, as limited income can mean less exposure to technology (or efficient technology).
As we understand divides in internet access, and see how local and regional efforts are being made to ensure equity, the question of responsibility remains. The graphic below, from Commonsense Media, reveals the digital and academic achievement gaps in K-12 education, and proposes policy action.
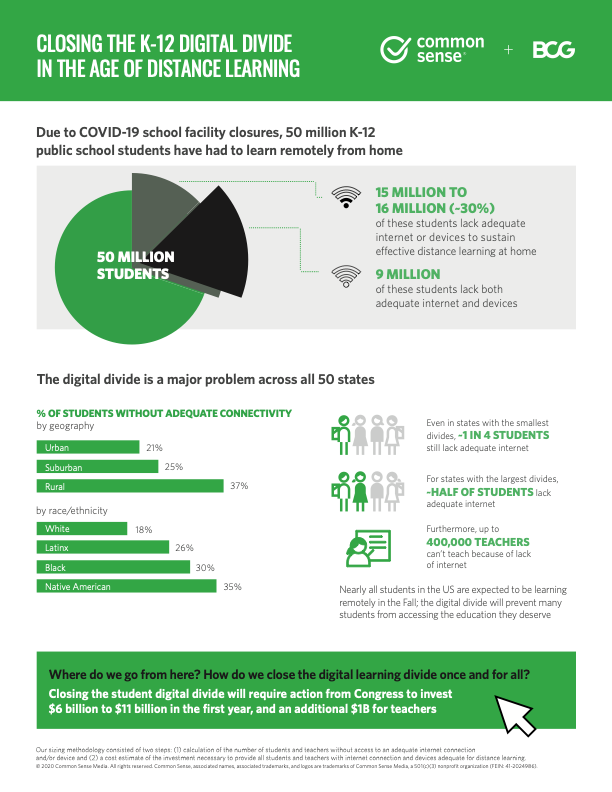
In 2021, Pew Research asked a representative sample of U.S. individuals if the government is responsible for ensuring internet access (McClain et al, 2021). The majority (62%) said no. Seventy percent don’t believe it’s the government’s responsibility to ensure that all Americans have cell phone access. Differences in this opinion fall along political views, with Democrats twice as likely to support the government’s role than Republicans. Those with lower incomes are more likely to favor government assistance. What do you believe? Whose responsibility is it to ensure internet access, and what do we mean by “ensure”?
Within Family Differences
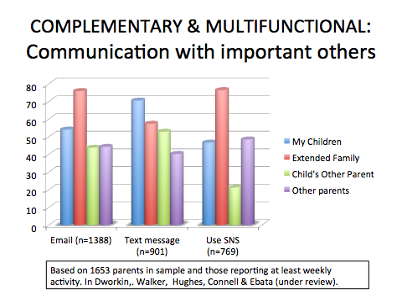
Families, particularly those with children still in school, may represent a fairly stable picture of race, ethnicity, education, income, and geography. Yet within the family there will be differences in technology use due to differences in individuals and individual relationships and roles. In the figure below, using data from 2012, we see that parents reported using email and social media more often with extended family, while they were more likely to text their children and the other parent.
In our early study of 1653 parents, we clustered them based on their technology use, identifying differences by the number and frequency of devices used, variations in device functions, and attitudes towards technology (Walker, et al., 2011). As you can see in the figure, the majority used technology in moderation, used it for a variety of functions, and had positive attitudes. In the green areas there were a number of parents we called the “omnivores,” those who possessed more devices, participated in a wide variety of activities, and had very positive attitudes about technology. Also in the green zone where those who used technology frequently and used a limited number of devices, along with those who had many devices, used them frequently, and weren’t happy about it. Minimal users seemed happy with their limited use or were indifferent or almost seem to experiment using various technologies. Again, we see wide variation by device ownership, frequency of use, and attitudes. It isn’t unusual for parents as adults in the same household to hold positions at different sections of this attitude-device-action spectrum.
Sophistication mapping of differences in technology use within families can be used to predict potential attitudinal differences and relational interactions. Readers are encouraged to use Hertlein and Blumer’s (2015) family technology-focused genogram to explore family technology dynamics.
Across family differences

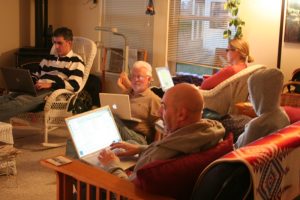
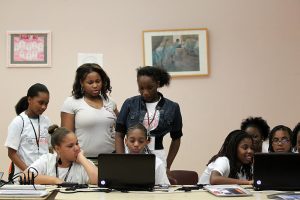
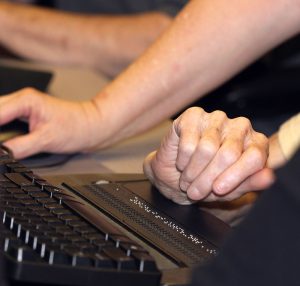
Now that you’ve considered the differences in your own family, think about two other families you know well. Perhaps they are families of your friends or your partner, people on your street, or relative’s families. How would you describe their technology use as a family? Consider their roles and relationships, family configurations, and conditions regarding access and skill for each family member (as well as you can). Does the family have a lot of devices? Are they avid gamers? Do they hold jobs or attend school in ways that dictate member use? See, for example, the picture to the right, with the deployed father connecting with his family back home. Or perhaps families that are immigrating to a new country (such as those currently fleeing from the Ukraine or from Serbia). Regardless of the reason for transnational status, families depend heavily on the internet and digital devices to stay connected to each other and to valuable information that help families thrive. Considering your own family and these other two, how similar or different would you say they are in their technology use?
Access
Earlier, we focused on family differences in access to the internet and to cell phone services. As these factors influence individuals within families in terms of their comfort, skill, and outcomes related to technology integration in their lives, they also mean whole family differences. As Karraker (2015) notes, disparities in technology access, and resultant inequalities between groups of families, exacerbate economic inequality, representations of the idea of family, and representations of gender. They diminish family members’ voices in the virtual environment, to the degree that we ask whose norms and values are being transmitted. During COVID, limits on access meant differences in educational achievement that favored higher-income families. And as we consider the economic value to families of having internet access, with the functional ability to help families communicate, purchase goods, find transportation, and make connections for their children’s education and their family’s health, we begin to see the critical importance of an equitable Global Society that ensures access to the internet for all.
We’ve observed the political divisions and differences in opinion about the U.S. federal government ensuring internet access for families. The United Nations Bill of Human Rights identifies access to the internet as a basic human right. From a family science perspective, the question of access holds different meaning. As Karraker (2015) noted, “meeting global families where they live regarding digital communication will force family scholars to continue to examine our very suppositions of what it means to be a family” (p. 70). As we work to understand how family members and families as a whole differ in their use of technology (in terms of functions and desired activities; attitudes, comfort, and skill; and access and exposure), we should ask what this work means to the research we conduct with families, and to the design and delivery of family services. Further, as we discuss in chapter 12, we must attend to public and social policy that attends to access to the internet as a basic human right.
Conclusion
As we are cautious to define family, so too are we cautious in assuming how families use technology. Families are as likely to vary in their use as family members are to vary from one another. The internal dynamics of use differences are critical to our understanding of communication and relationship dynamics, and to the role demands that may be fulfilled through the use of ICT. Across families, we see large differences in attitudes and preferences, and also in factors that policy can address — most importantly, access, comfort, and skill in using technology. It is in these differences that knowledge, digital, and information divides occur, divides that exacerbate inequities in our global society.
In Chapters 4 through 10 we explore specific ways in which family members and subsystems of the family, use technology and the impacts on their individual and collective well-being.
