5.3 Unemployment
Learning Objectives
- Explain how unemployment is measured in the United States.
- Define three different types of unemployment.
- Define and illustrate graphically what is meant by the natural level of employment. Relate the natural level of employment to the natural rate of unemployment.
For an economy to produce all it can and achieve a solution on its production possibilities curve, the factors of production in the economy must be fully employed. Failure to fully employ these factors leads to a solution inside the production possibilities curve in which society is not achieving the output it is capable of producing.
In thinking about the employment of society’s factors of production, we place special emphasis on labor. The loss of a job can wipe out a household’s entire income; it is a more compelling human problem than, say, unemployed capital, such as a vacant apartment. In measuring unemployment, we thus focus on labor rather than on capital and natural resources.
Measuring Unemployment
The Bureau of Labor Statistics defines a person as unemployed if he or she is not working but is looking for and available for work. The labor force is the total number of people working or unemployed. The unemployment rate is the percentage of the labor force that is unemployed.
To estimate the unemployment rate, government surveyors fan out across the country each month to visit roughly 60,000 households. At each of these randomly selected households, the surveyor asks about the employment status of each adult (everyone age 16 or over) who lives there. Many households include more than one adult; the survey gathers information on about roughly 100,000 adults. The surveyor asks if each adult is working. If the answer is yes, the person is counted as employed. If the answer is no, the surveyor asks if that person has looked for work at some time during the previous four weeks and is available for work at the time of the survey. If the answer to that question is yes, the person is counted as unemployed. If the answer is no, that person is not counted as a member of the labor force. Figure 5.4 “Computing the Unemployment Rate” shows the survey’s results for the civilian (nonmilitary) population for February 2012. The unemployment rate is then computed as the number of people unemployed divided by the labor force—the sum of the number of people not working but available and looking for work plus the number of people working. In February 2012, the unemployment rate was 8.3%.
Figure 5.4 Computing the Unemployment Rate
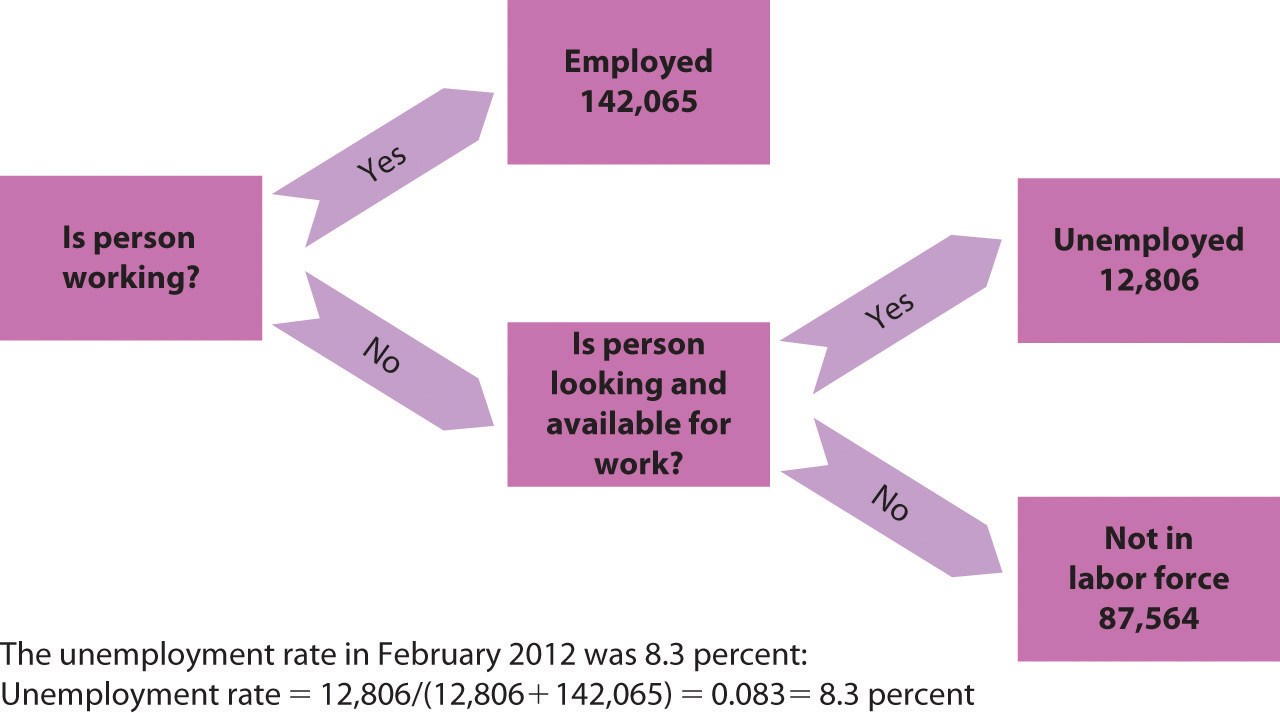
A monthly survey of households divides the civilian adult population into three groups. Those who have jobs are counted as employed; those who do not have jobs but are looking for them and are available for work are counted as unemployed; and those who are not working and are not looking for work are not counted as members of the labor force. The unemployment rate equals the number of people looking for work divided by the sum of the number of people looking for work and the number of people employed. Values are for February 2012. All numbers are in thousands.
There are several difficulties with the survey. The old survey, designed during the 1930s, put the “Are you working?” question differently depending on whether the respondent was a man or woman. A man was asked, “Last week, did you do any work for pay or profit?” A woman was asked, “What were you doing for work last week, keeping house or something else?” Consequently, many women who were looking for paid work stated that they were “keeping house”; those women were not counted as unemployed. The BLS did not get around to fixing the survey—asking women the same question it asked men—until 1994. The first time the new survey question was used, the unemployment rate among women rose by 0.5 percentage point. More than 50 million women are in the labor force; the change added more than a quarter of a million workers to the official count of the unemployed.[1]
The problem of understating unemployment among women has been fixed, but others remain. A worker who has been cut back to part-time work still counts as employed, even if that worker would prefer to work full time. A person who is out of work, would like to work, has looked for work in the past year, and is available for work, but who has given up looking, is considered a discouraged worker. Discouraged workers are not counted as unemployed, but a tally is kept each month of the number of discouraged workers.
The official measures of employment and unemployment can yield unexpected results. For example, when firms expand output, they may be reluctant to hire additional workers until they can be sure the demand for increased output will be sustained. They may respond first by extending the hours of employees previously reduced to part-time work or by asking full-time personnel to work overtime. None of that will increase employment, because people are simply counted as “employed” if they are working, regardless of how much or how little they are working. In addition, an economic expansion may make discouraged workers more optimistic about job prospects, and they may resume their job searches. Engaging in a search makes them unemployed again—and increases unemployment. Thus, an economic expansion may have little effect initially on employment and may even increase unemployment.
Types of Unemployment
Workers may find themselves unemployed for different reasons. Each source of unemployment has quite different implications, not only for the workers it affects but also for public policy.
Figure 5.5 “The Natural Level of Employment” applies the demand and supply model to the labor market. The price of labor is taken as the real wage, which is the nominal wage divided by the price level; the symbol used to represent the real wage is the Greek letter omega, ω. The supply curve is drawn as upward sloping, though steep, to reflect studies showing that the quantity of labor supplied at any one time is nearly fixed. Thus, an increase in the real wage induces a relatively small increase in the quantity of labor supplied. The demand curve shows the quantity of labor demanded at each real wage. The lower the real wage, the greater the quantity of labor firms will demand. In the case shown here, the real wage, ωe, equals the equilibrium solution defined by the intersection of the demand curve D1 and the supply curve S1. The quantity of labor demanded, Le, equals the quantity supplied. The employment level at which the quantity of labor demanded equals the quantity supplied is called the natural level of employment. It is sometimes referred to as full employment.
Figure 5.5 The Natural Level of Employment
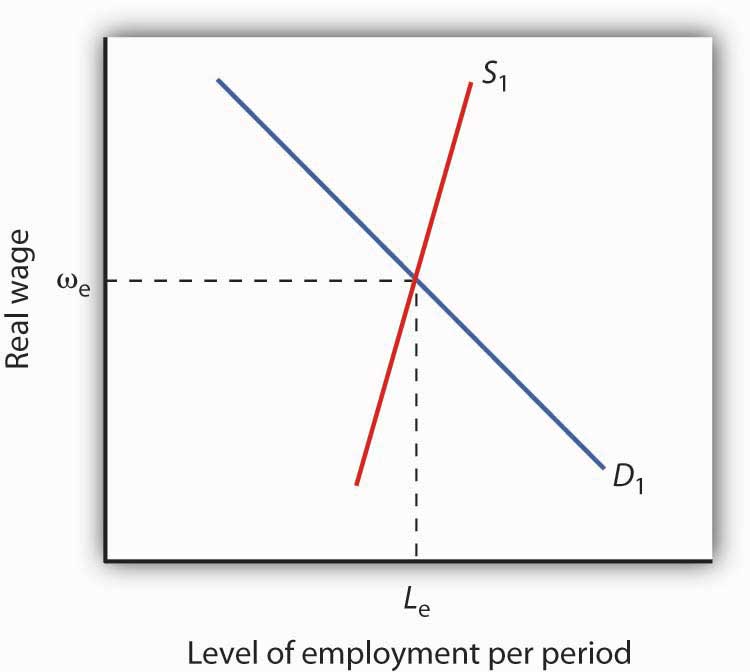
The employment level at which the quantity of labor demanded equals the quantity supplied is called the natural level of employment. Here, the natural level of employment is Le, which is achieved at a real wage ωe.
Even if the economy is operating at its natural level of employment, there will still be some unemployment. The rate of unemployment consistent with the natural level of employment is called the natural rate of unemployment. Business cycles may generate additional unemployment. We discuss these various sources of unemployment below.
Frictional Unemployment
Even when the quantity of labor demanded equals the quantity of labor supplied, not all employers and potential workers have found each other. Some workers are looking for jobs, and some employers are looking for workers. During the time it takes to match them up, the workers are unemployed. Unemployment that occurs because it takes time for employers and workers to find each other is called frictional unemployment.
The case of college graduates engaged in job searches is a good example of frictional unemployment. Those who did not land a job while still in school will seek work. Most of them will find jobs, but it will take time. During that time, these new graduates will be unemployed. If information about the labor market were costless, firms and potential workers would instantly know everything they needed to know about each other and there would be no need for searches on the part of workers and firms. There would be no frictional unemployment. But information is costly. Job searches are needed to produce this information, and frictional unemployment exists while the searches continue.
The government may attempt to reduce frictional unemployment by focusing on its source: information costs. Many state agencies, for example, serve as clearinghouses for job market information. They encourage firms seeking workers and workers seeking jobs to register with them. To the extent that such efforts make labor-market information more readily available, they reduce frictional unemployment.
Structural Unemployment
Another reason there can be unemployment even if employment equals its natural level stems from potential mismatches between the skills employers seek and the skills potential workers offer. Every worker is different; every job has its special characteristics and requirements. The qualifications of job seekers may not match those that firms require. Even if the number of employees firms demand equals the number of workers available, people whose qualifications do not satisfy what firms are seeking will find themselves without work. Unemployment that results from a mismatch between worker qualifications and the characteristics employers require is called structural unemployment.
Structural unemployment emerges for several reasons. Technological change may make some skills obsolete or require new ones. The widespread introduction of personal computers since the 1980s, for example, has lowered demand for typists who lacked computer skills.
Structural unemployment can occur if too many or too few workers seek training or education that matches job requirements. Students cannot predict precisely how many jobs there will be in a particular category when they graduate, and they are not likely to know how many of their fellow students are training for these jobs. Structural unemployment can easily occur if students guess wrong about how many workers will be needed or how many will be supplied.
Structural unemployment can also result from geographical mismatches. Economic activity may be booming in one region and slumping in another. It will take time for unemployed workers to relocate and find new jobs. And poor or costly transportation may block some urban residents from obtaining jobs only a few miles away.
Public policy responses to structural unemployment generally focus on job training and education to equip workers with the skills firms demand. The government publishes regional labor-market information, helping to inform unemployed workers of where jobs can be found. The North American Free Trade Agreement (NAFTA), which created a free trade region encompassing Mexico, the United States, and Canada, has created some structural unemployment in the three countries. In the United States, the legislation authorizing the pact also provided for job training programs for displaced U.S. workers.
Although government programs may reduce frictional and structural unemployment, they cannot eliminate it. Information in the labor market will always have a cost, and that cost creates frictional unemployment. An economy with changing demands for goods and services, changing technology, and changing production costs will always have some sectors expanding and others contracting—structural unemployment is inevitable. An economy at its natural level of employment will therefore have frictional and structural unemployment.
Cyclical Unemployment
Of course, the economy may not be operating at its natural level of employment, so unemployment may be above or below its natural level. In a later chapter we will explore what happens when the economy generates employment greater or less than the natural level. Cyclical unemployment is unemployment in excess of the unemployment that exists at the natural level of employment.
Figure 5.6 “Unemployment Rate, 1960–2011” shows the unemployment rate in the United States for the period from 1960 through 2011. We see that it has fluctuated considerably. How much of it corresponds to the natural rate of unemployment varies over time with changing circumstances. For example, in a country with a demographic “bulge” of new entrants into the labor force, frictional unemployment is likely to be high, because it takes the new entrants some time to find their first jobs. This factor alone would raise the natural rate of unemployment. A demographic shift toward more mature workers would lower the natural rate. During recessions, highlighted in Figure 5.6 “Unemployment Rate, 1960–2011”, the part of unemployment that is cyclical unemployment grows. The analysis of fluctuations in the unemployment rate, and the government’s responses to them, will occupy center stage in much of the remainder of this book.
Figure 5.6 Unemployment Rate, 1960–2011
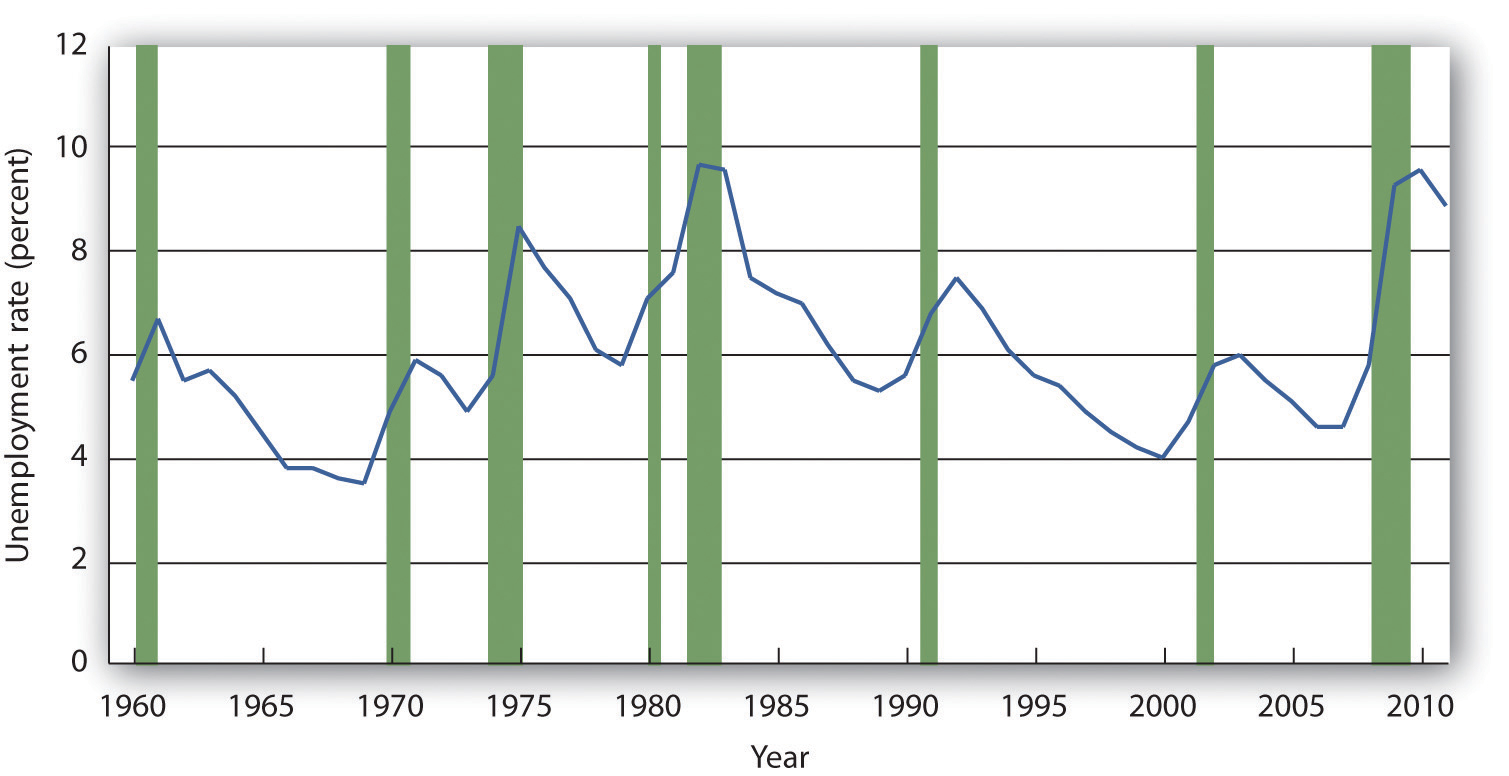
The chart shows the unemployment rate for each year from 1960 to 2011. Recessions are shown as shaded areas.
Source: Economic Report of the President, 2012, Table B-42.
Key Takeaways
- People who are not working but are looking and available for work at any one time are considered unemployed. The unemployment rate is the percentage of the labor force that is unemployed.
- When the labor market is in equilibrium, employment is at the natural level and the unemployment rate equals the natural rate of unemployment.
- Even if employment is at the natural level, the economy will experience frictional and structural unemployment. Cyclical unemployment is unemployment in excess of that associated with the natural level of employment.
Try It!
Given the data in the table, compute the unemployment rate in Year 1 and in Year 2. Explain why, in this example, both the number of people employed and the unemployment rate increased.
| Year | Number employed (in millions) | Number unemployed (in millions) |
|---|---|---|
| 1 | 20 | 2 |
| 2 | 21 | 2.4 |
Case in Point: Might Increased Structural Unemployment Explain the “Jobless Recovery” Following the 2001 Recession?

A. Golden – the US$ 3 TRILLION HEIST, – CC BY-NC-ND 2.0.
The U.S. 2001 recession was mild by historical standards, but recovery in terms of increased employment seemed painfully slow in coming. Economists Erica Goshen and Simon Potter at the Federal Reserve Bank of New York think the reason for the slow recovery in jobs may have actually reflected structural changes in the U.S. economy. They argue that during the recession permanent rather than temporary layoffs predominated and that it takes longer for firms to hire workers into new positions than to hire them back into former jobs.
What is their evidence? When the layoff is temporary, the employer “suspends” the job, due to slack demand, and the employee expects to be recalled once demand picks up. With a permanent layoff, the employer eliminates the job. So, they looked at the contribution of temporary layoffs to the unemployment rate during the recent recession compared to the situation in the four recessions before 1990. In the earlier recessions, unemployment from temporary layoffs rose when the economy was shrinking and fell after the economy began to recover. In both the 1991 and 2001 recessions, temporary layoffs were minor. Then, the authors examined job flows in 70 industries. They classified layoffs in an industry as being cyclical in nature if the job losses during the recession were reversed during the recovery but structural if job losses for the industry continued during the recovery. Their analysis revealed that during the recession of the early 1980s, job losses were about evenly split between cyclical and structural changes. In the 1991 recession and then more strongly in the 2001 recession, structural changes dominated. “Most of the industries that lost jobs during the [2001] recession—for example, communications, electronic equipment, and securities and commodities brokers—[were] still losing jobs” in 2003. “The trend revealed . . . is one in which jobs are relocated from some industries to others, not reclaimed by the same industries that lost them earlier.”
The authors suggest three possible reasons for the recent increased role of structural change: (1) The structural decline in some industries could be the result of overexpansion in those industries during the 1990s. The high tech and telecommunications industries in particular could be examples of industries that were overbuilt before the 2001 recession. (2) Improved government policies may have reduced cyclical unemployment. Examination of macroeconomic policy in future chapters will return to this issue. (3) New management strategies to reduce costs may be promoting leaner staffing. For firms adopting such strategies, a recession may provide an opportunity to reorganize the production process permanently and reduce payrolls in the process.
Goshen and Potter point out that, for workers, finding new jobs is harder than simply returning to old ones. For firms, making decisions about the nature of new jobs is time consuming at best. The uncertainty created by the war in Iraq and the imposition of new accounting standards following the “Enron”-like scandals may have further prolonged the creation of new jobs.
Source: Erica L. Goshen and Simon Potter, “Has Structural Change Contributed to a Jobless Recovery?” Federal Reserve Bank of New York Current Issues in Economics and Finance 9, no. 8 (August 2003): 1–7.
Answer to Try It! Problem
In Year 1 the total labor force includes 22 million workers, and so the unemployment rate is 2/22 = 9.1%. In Year 2 the total labor force numbers 23.4 million workers; therefore the unemployment rate is 2.4/23.4 = 10.3%. In this example, both the number of people employed and the unemployment rate rose, because more people (23.4 − 22 = 1.4 million) entered the labor force, of whom 1 million found jobs and 0.4 million were still looking for jobs.
- For a description of the new survey and other changes introduced in the method of counting unemployment, see Janet L. Norwood and Judith M. Tanur, “Unemployment Measures for the Nineties,” Public Opinion Quarterly 58, no. 2 (Summer 1994): 277–94. ↵
