2.16 Phylogenetic trees
Phylogenies tell an evolutionary story
A phylogeny represents the evolutionary relationships between different types of organisms. When we say “turtles, lizards, snakes, birds, and mammals are all amniotes” (animals that reproduce with specialized, amniotic eggs), we are speaking phylogenetically.
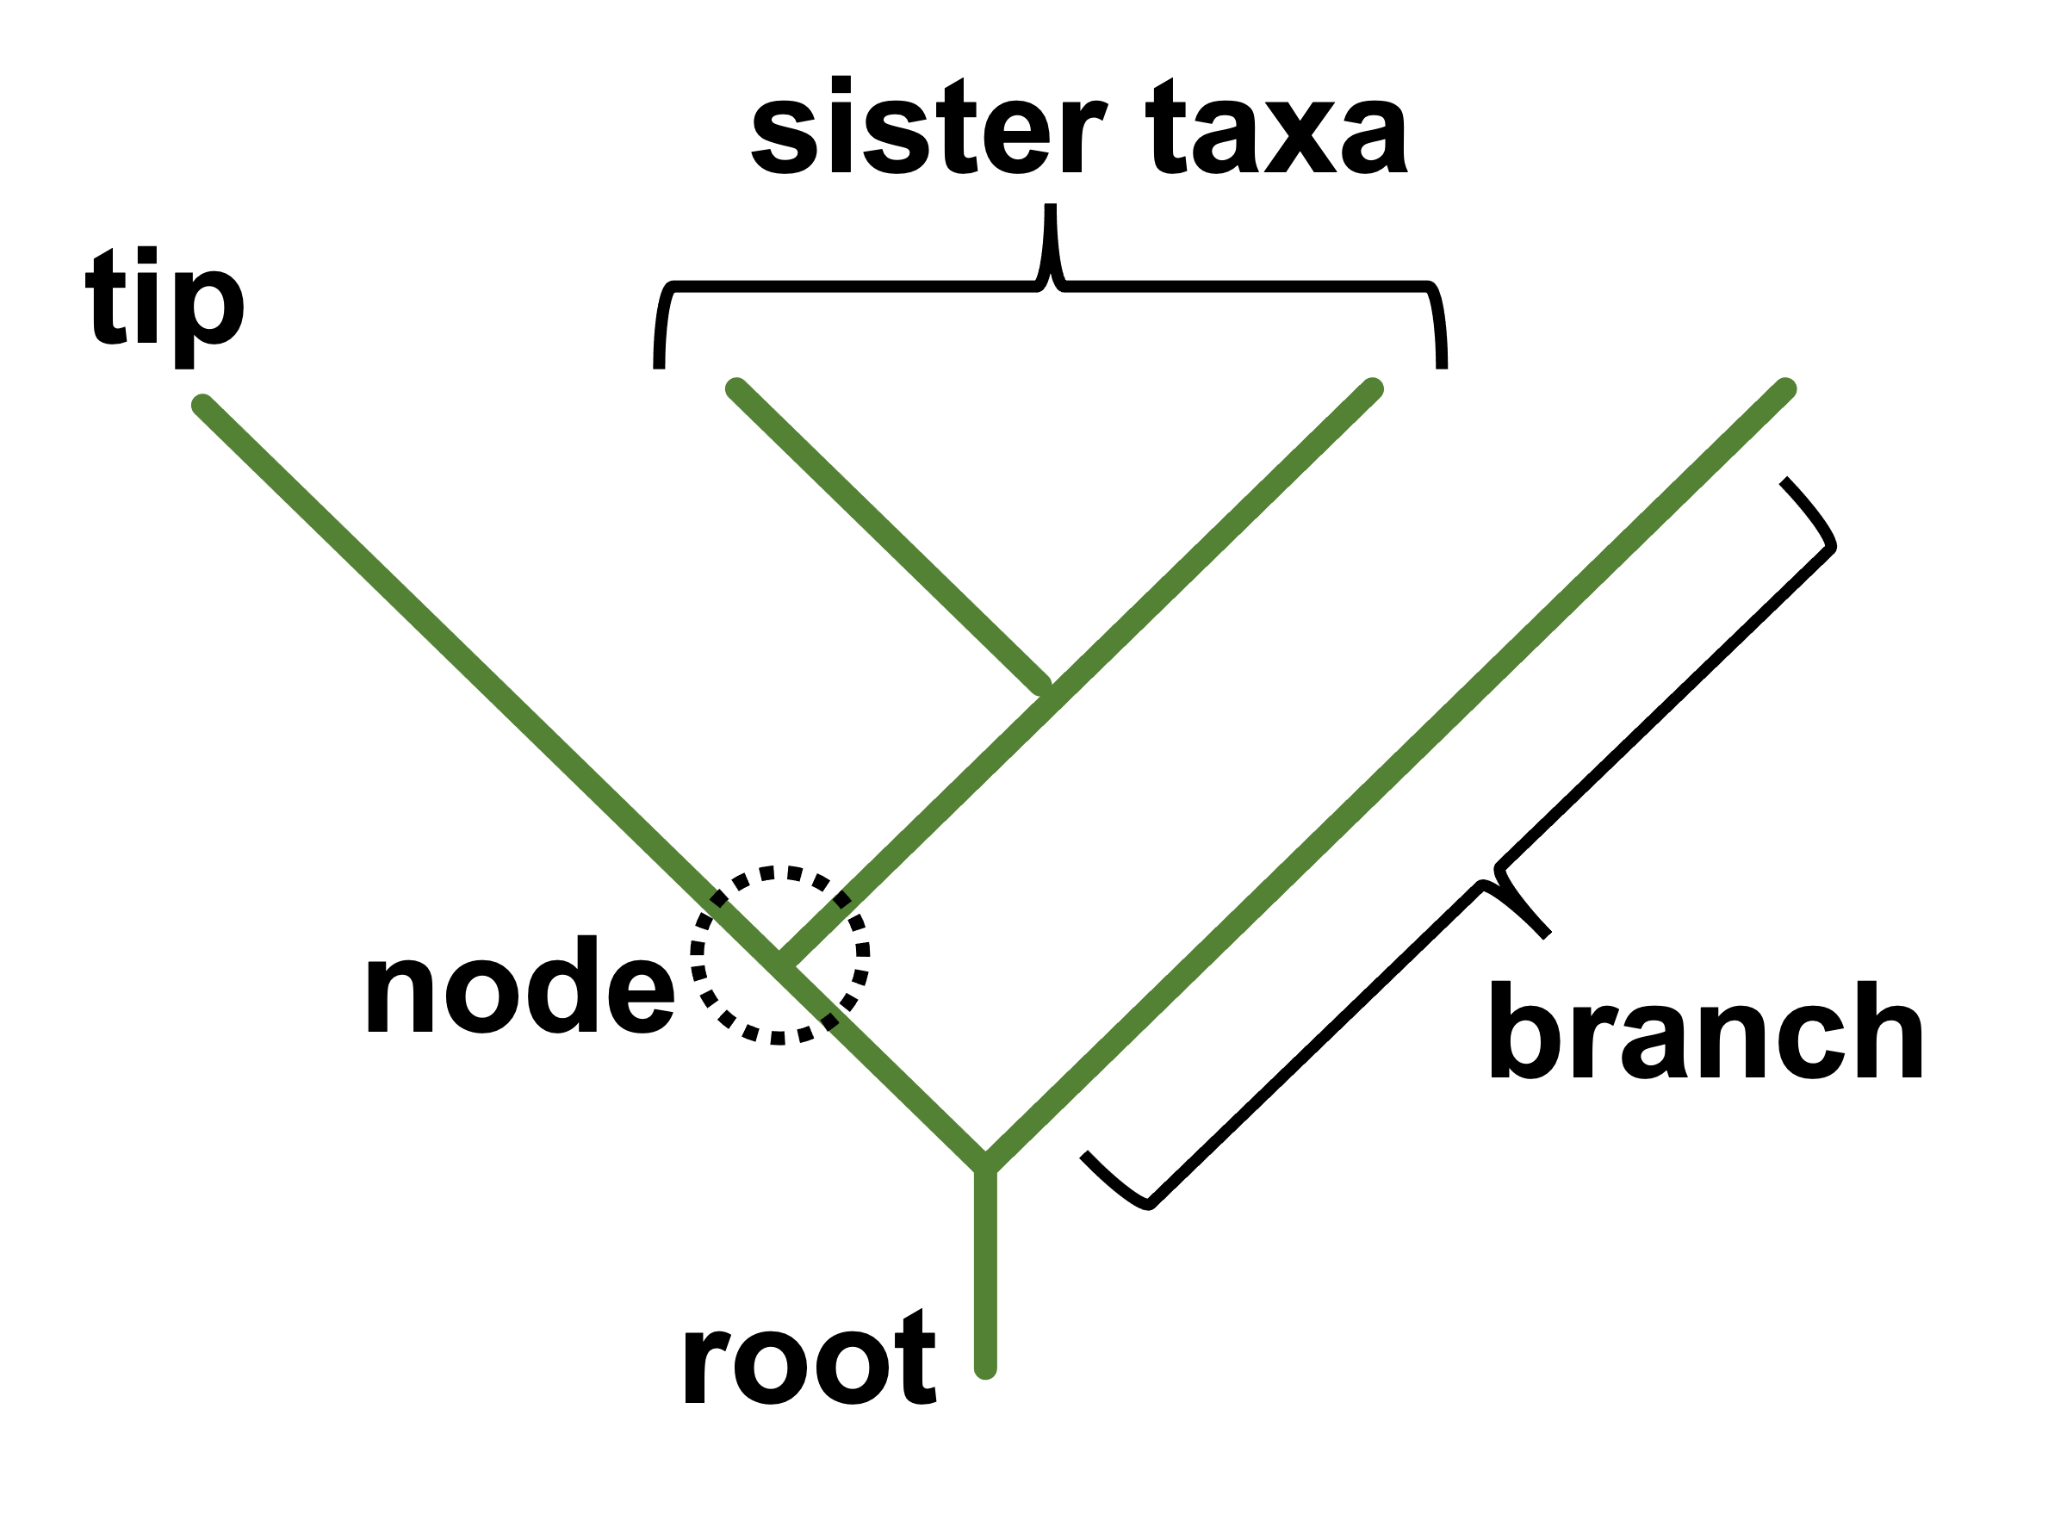
Biologists use phylogenetic trees to visualize these evolutionary relationships (Figure 2.20). Time is very important to understanding a phylogenetic tree. Time moves from the root to the tips, meaning the root is farther back in time while the tips represent the present. In a phylogenetic tree, species that are currently living are shown at the ends of branches on what are called “tips”. If you start at a tip and go away from the tip along a branch you will be moving back in time and will eventually reach a node, where two branches connect. Nodes represent species that existed in the past and are the common ancestor of the species at the tips. If two species are connected by a node that is close to the tips (further “up” the tree above), they are more closely related to each other, compared to species that are connected by nodes that are further towards the root. “Sister taxa” are species that are most closely related, connected by a single node. The node at the root of the tree represents the most recent common ancestor of all species on the tree. The term “most recent common ancestor” refers to the ancestor species represented by a node connecting whichever species (two or more) that you are comparing.
A guide to reading trees
Phylogenetic trees can be tricky to interpret, and there are some common mistakes people make. Here is a guide to reading phylogenetic trees. We recommend that you practice avoiding misconceptions by using the two trees shown in Figure 2.21.
1) Trees can have straight lines (like Figure 2.20 above) or lines with corners (see Figure 2.21 above). The tips may be oriented facing up, down, right, or left. You might even see a tree that is circular and branches out from a node at the center. All of these tree styles are interchangeable and the choice depends on preference or space constraints. The way species are connected through nodes as you travel away from the root is the only aspect of a tree that matters. Movement from the root to tips always indicates moving forward in time, regardless of how the entire tree is oriented.
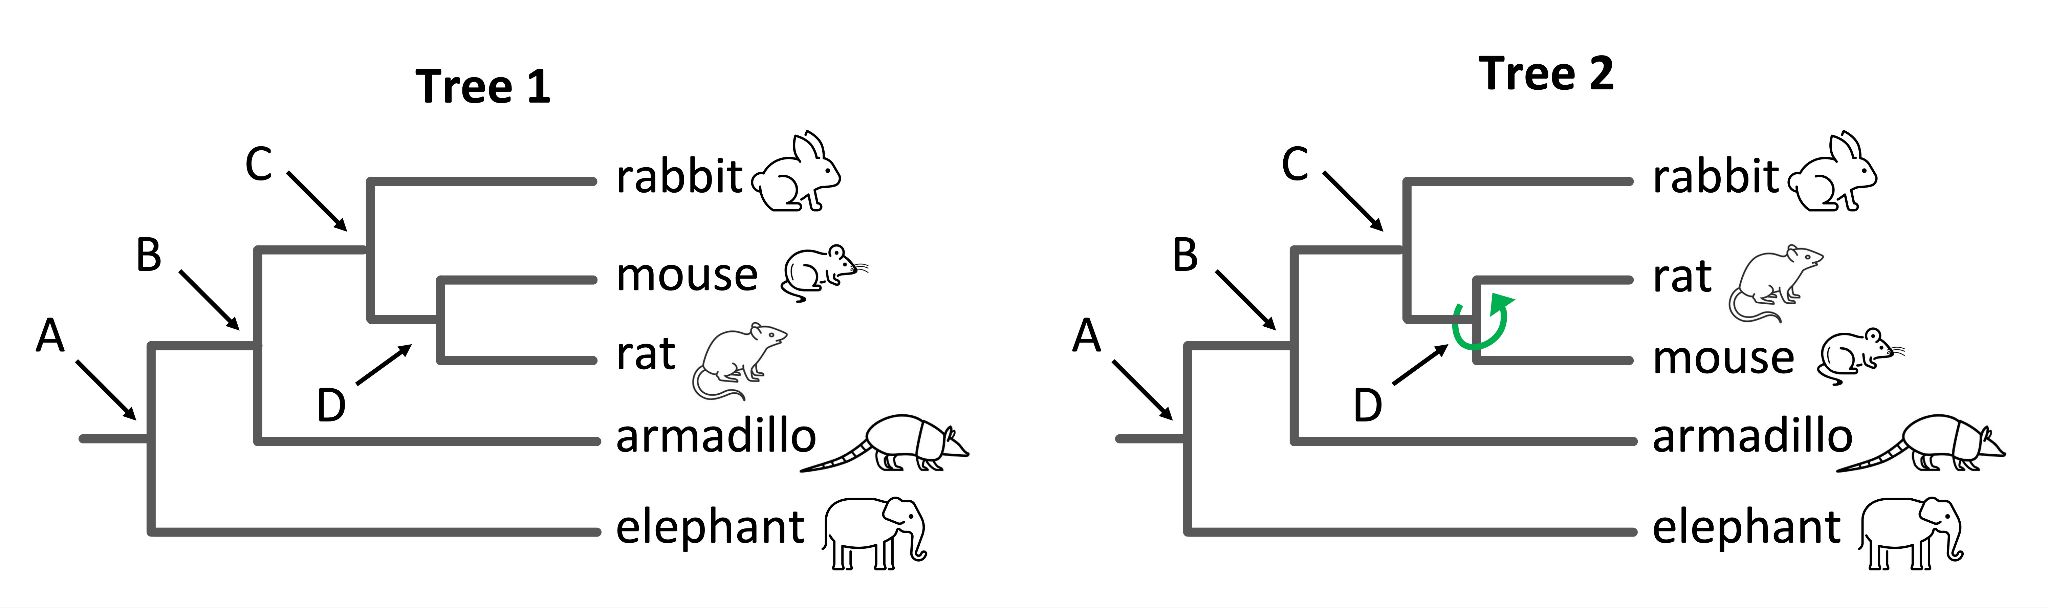
2) A node represents a species that actually existed in the past and is the ancestor of all of the species that branch off from that node. On the trees in Figure 2.21, the most recent common ancestor of mice and rats is shown at node D. Both mice and rats descend from that common ancestor, which is no longer living today. Sometimes we have information about that ancestor from fossil or DNA evidence, but often we do not. However, we still know that the common ancestor existed.
3) Each node can be rotated and still show the exact same relationship between species. Compare Tree 1 and Tree 2 above. What is different? The two trees are identical, except node D has been rotated, making the rat tip above the mouse tip. The information given in the two trees is identical. The same would be true if any of the other nodes were rotated, or even all of the nodes.
4) Reading “across the tips” and ignoring tree structure (nodes) is incorrect – this is a very common mistake that you should avoid. Looking at how close tips are to one another and ignoring the nodes and the branching structure of the tree leads to incorrect conclusions about how species are related. To understand this concept, remember that nodes can be rotated without changing any relationships between species.
Check Yourself
5) In order to find common ancestors of specific species, you need to follow branches back to nodes instead of looking at the tip placement. Practice with the questions below.
Check Yourself
Check Yourself
Human evolution and interbreeding
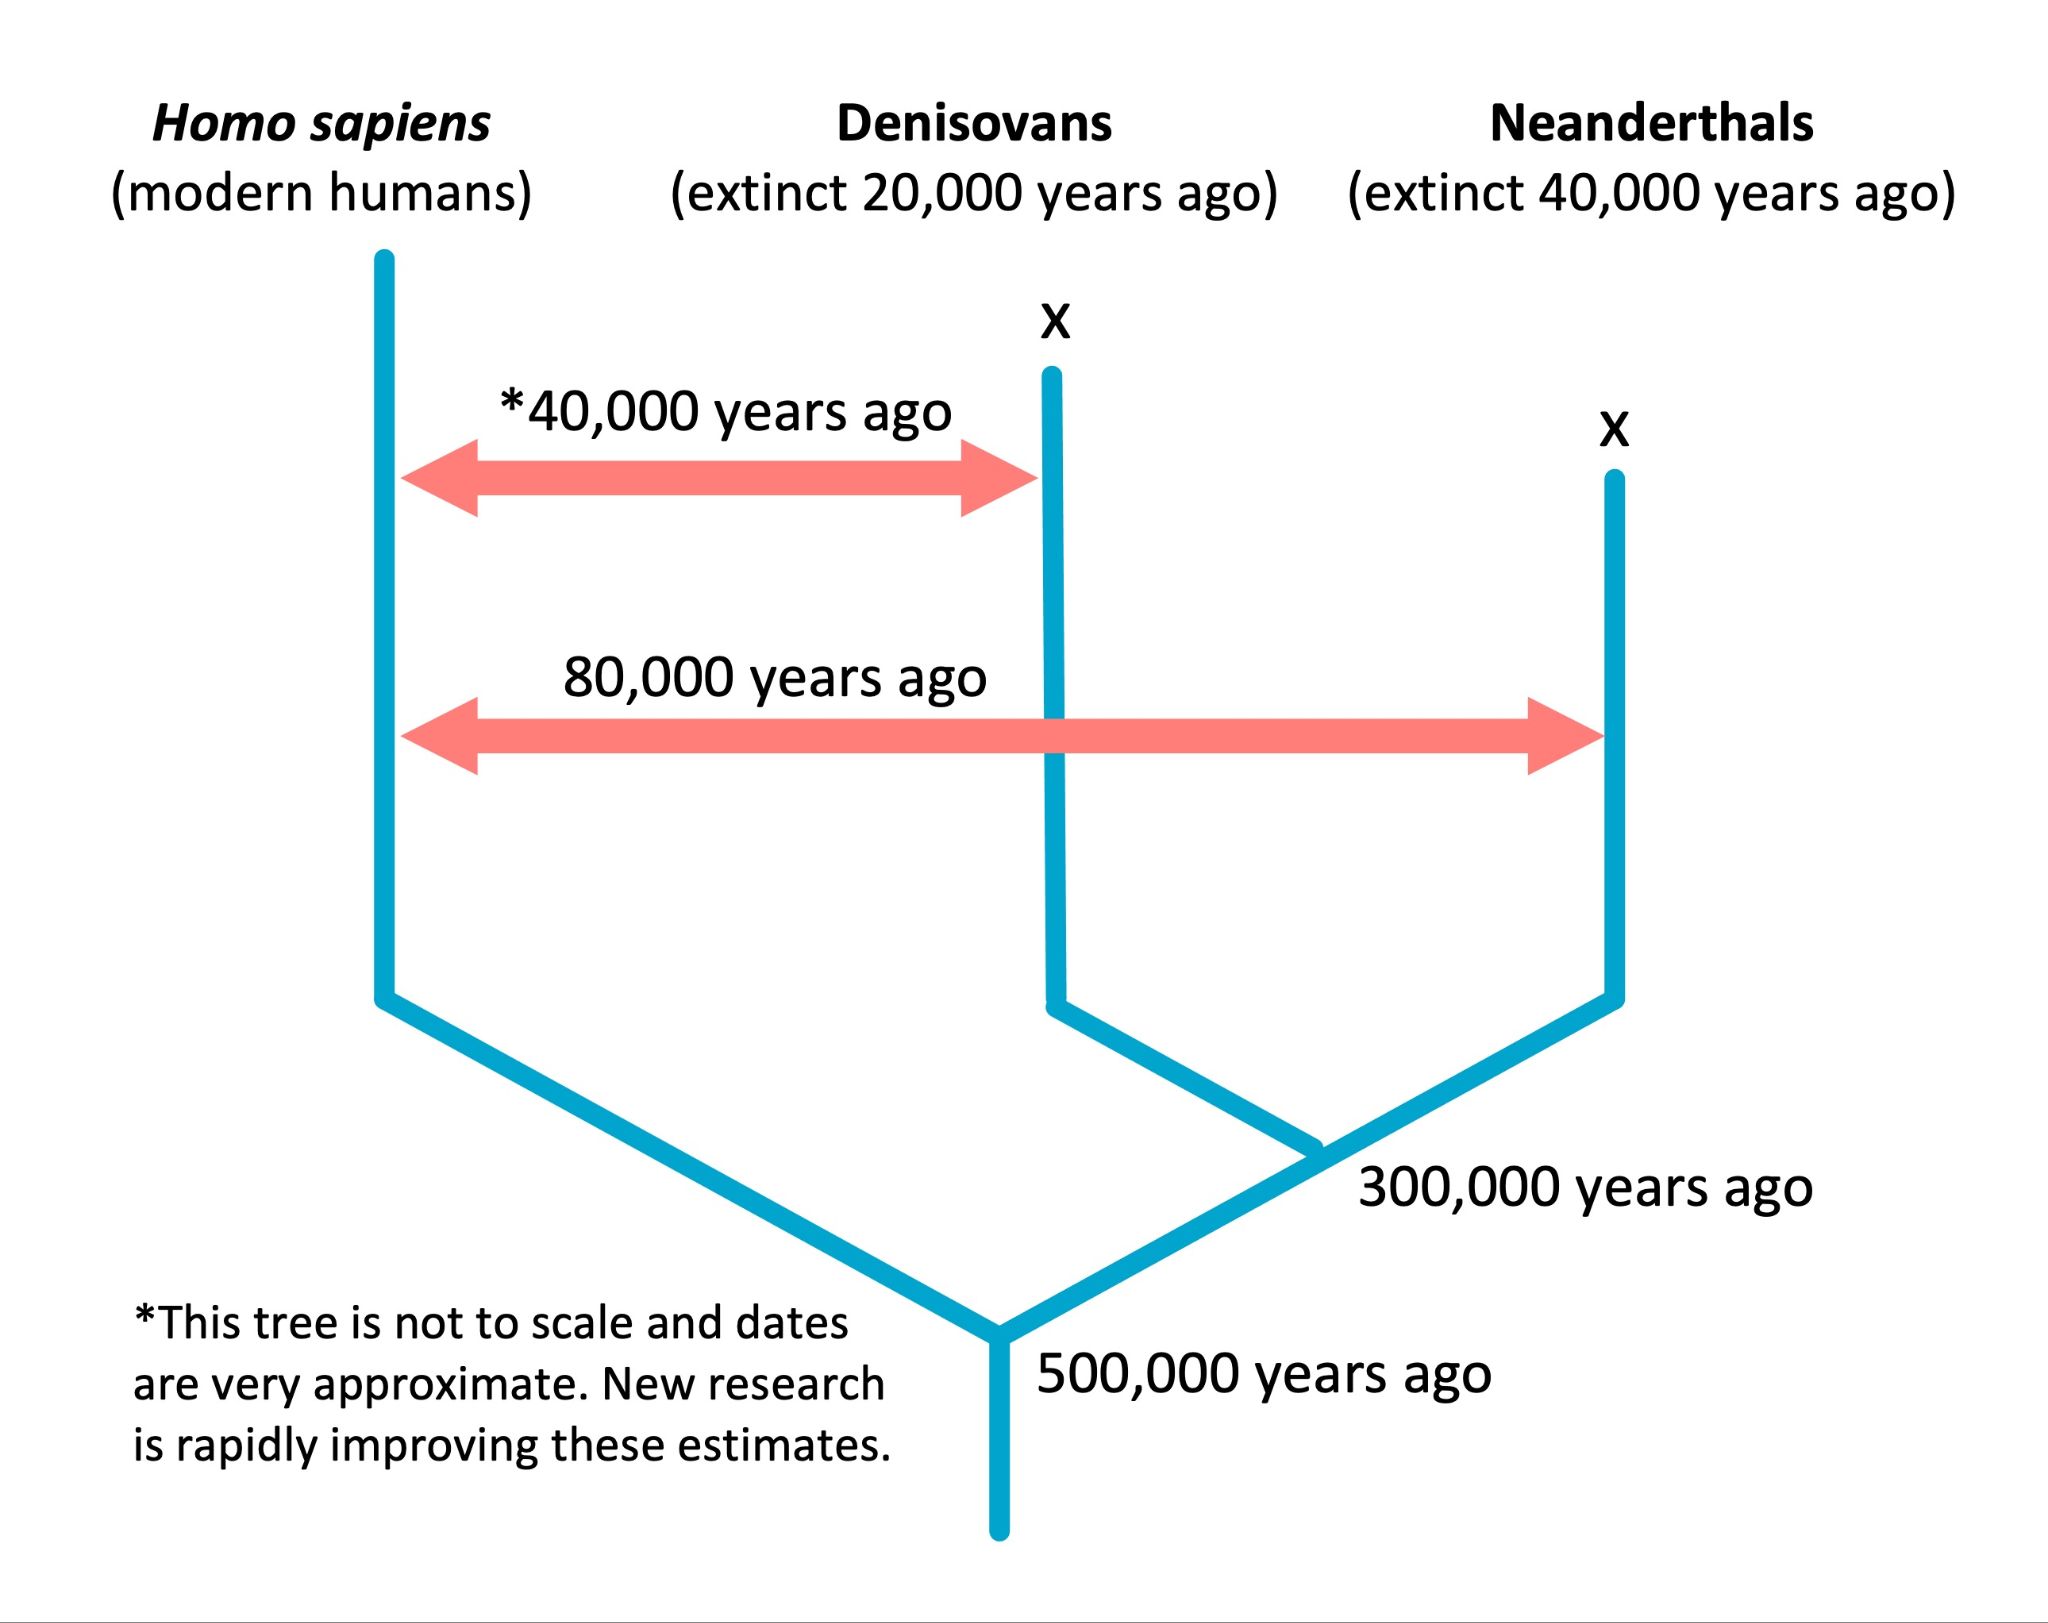
Phylogenetic explorations of humans and our cousin species have been incredibly useful in understanding our evolution. Figure 2.22 shows a tree with modern humans, Denisovans, and Neanderthals – Denisovans and Neanderthals are ancient human-like populations that are now extinct. (Notice the x marks at the tips of the Denisovans and Neanderthals, which indicate that Denisovans and Neanderthals are extinct.) The pink arrows on the tree show gene flow between Denisovans and the ancestors of modern humans, which occurred around 40,000 years ago, and gene flow between Neanderthals and our ancestors, which occurred around 80,000 years ago. Biologists have recently been able to extract Neanderthal and Denisovan DNA from fossils. The DNA is highly degraded, but biologists use recently-developed techniques to piece it back together, and then make comparisons to modern humans.
Ask Yourself
Remember the biological species concept discussed in Section 2.15? Under the biological species concept, should Denisovans and the ancestors of modern humans that lived 40,000 years ago be considered the same species, or different species? What about Neanderthals and our human ancestors that lived 80,000 years ago?
Showing traits on trees
Phylogenetic trees can also show when certain traits evolved and which species have those traits. For example, Figure 2.23 shows a tree with several animal species. The labeled tick marks show when different traits evolved. For example, lungs evolved within a species that was a common ancestor of antelopes, bald eagles, and alligators; this means present-day antelopes, bald eagles, and alligators have lungs. We also learn from that tick mark that lamprey and sea bass do not have lungs. Fur evolved within an ancestor of modern-day antelopes. Only antelopes have fur – all other species do not. We can also see that all species except lamprey have jaws. Note that tick marks may also show where a trait is lost – there aren’t any tick marks like that in Figure 2.23, but many trees do show trait losses, because traits can be both gained and lost over evolutionary time.
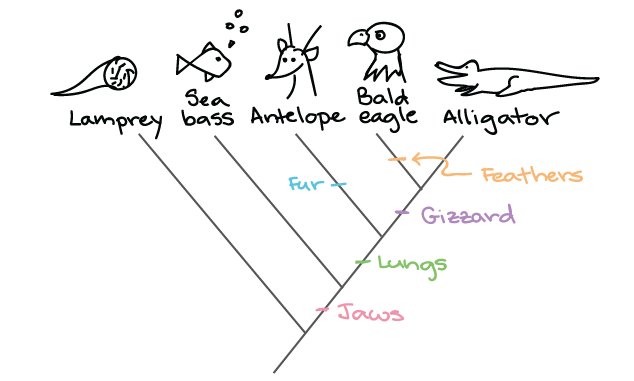
Figure 2.23 A tree with traits. Each tick mark shows when the corresponding trait evolved. This information tells us what traits different species have. For example, we can see that antelopes have fur, and that all species except for lamprey have jaws. [4]
Check Yourself
Content on this page was originally published in The Evolution and Biology of Sex by Sehoya Cotner & Deena Wassenberg and has been expanded and updated by Katherine Furniss & Sarah Hammarlund in compliance with the original CC-BY-NC 4.0 license.
- Image created by Sarah Hammarlund ↵
- Image created by Sarah Hammarlund ↵
- Image created by Sarah Hammarlund ↵
- Image from Khan Academy, shared with a CC BY-NC-SA 4.0 license; originally based on Taxonomy and phylogeny: Figure 6, by Robert Bear et al., CC BY 4.0 ↵
