1.4 Interpreting Data
In this course we’ll look at a lot of graphical representations of data. Looking at raw data can make it hard to notice any patterns or trends in our data. Taking that raw data and doing something with it can make it easier to interpret our data, identify any patterns or trends in the data, and form conclusions. Examine the figure we showed in the last section, copied below. What patterns do you observe in these data?
How to read the figure
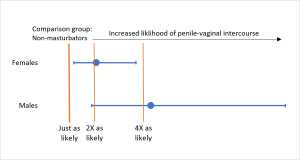
In the figure above, the blue dots represent the likelihood that people who have masturbated within the past year have had penile-vaginal intercourse as compared to those who have not masturbated. We can say that females that have masturbated in the past year are more than two times (2X) as likely to have had penile-vaginal intercourse than females who have not masturbated in the past year.
You might also have noticed there are blue lines coming out of each dot. These lines represent the 95% confidence interval (CI). The 95% CI is used to estimate the precision of the test. A 95% CI that overlaps with 1.0 (Just as likely) would suggest that the independent variable (HPV vaccination) is not associated with the dependent variable (penile-vaginal intercourse).
Interpreting the figure
Interpreting a figure can be quite intimidating for some. We will practice this skill in every class so hopefully by the end of the semester you are feeling more comfortable and confident!
When taking a first look at the data, don’t worry about all the details–just look for general trends or patterns. Basic statements like “this is more than that”, “this one increases while that one decreases”, etc. are a great way to start! Then you can start to add in the scientific terms and be more specific.
For the data in Figure 1.2 you might have observed the general pattern that when compared to individuals that have not masturbated in the past year, those that have masturbated are more likely to have had penile-vaginal intercourse.
Another pattern is that males that have masturbated are 4X more likely to have had penile-vaginal intercourse, while females that have masturbated in the past year are 2X more likely to have had penile-vaginal intercourse. This may lead you to ask new questions, but for now let’s continue to observe patterns and trends for these data.
Lastly, you may have noticed the 95% CI do not overlap with 1.0 (just as likely) and that the 95% CI for males is about 3X larger than the 95% CI for females. Again, this may make you curious to ask a follow-up question, but for now let’s continue the scientific process with our current question.
We began this chapter asking, “Why do animals, including humans, masturbate?”
We hypothesized that “Sexual pleasure is a motivational system for both non-reproductive sexual behavior like masturbation and also reproductive behavior, penile-vaginal intercourse.”
Because of that hypothesis, we predicted that “individuals that masturbate more frequently are more likely to have had penile-vaginal intercourse.”
Now, what do you think? Do these data support our hypothesis, or not? In other words, do these data meet our prediction? When you look at these data, the difference is certainly in the direction that matches our prediction, but how do we know if this difference is not just a fluke?
Scientists often use simple statistical tests to evaluate trends in their data. They can use statistical tests to determine if any observed differences, like those above, are “significant”– that is, are these differences likely to hold true if the experiment is repeated? In the figure above, scientists used a statistical analysis to create the confidence intervals. We will explore this more in a later section.
From hypothesis to theory
If many rounds of observation and experimentation using multiple methods serve to support a hypothesis, these lines of evidence can create a framework called a scientific theory. Yet, even theories are subject to revision via the process of science. For this reason, we discourage use of the terms “prove” and “proven” in science. Instead, terms like “support” or “suggest” are more appropriate and accurate.
Some similarities differences between hypotheses and theories
| Hypothesis | Theory |
| Written before any experiments have been performed | Written after many experiments have been performed |
| Provides a narrow explanation | Provides a broad explanation |
| Consistent with limited prior knowledge | Based on a wide range of data |
| Can be tested and falsified | Can be tested and falsified |
Read More
You’ll find an excellent overview of the nature of science at this link.
Content on this page was originally published in The Evolution and Biology of Sex by Sehoya Cotner & Deena Wassenberg and has been expanded and updated by Katherine Furniss & Sarah Hammarlund in compliance with the original CC-BY-NC 4.0 license.
