2: Conducting a Woodland Inventory
2. Conducting a Woodland Inventory
John G. DuPlissis, Silviculture Program Coordinator, University of Minnesota Natural Resources Research Institute
Charles R. Blinn, Extension Specialist, University of Minnesota
Bill Cook, Forestry Educator, Michigan State University
Paul Doruska, Professor, University of Wisconsin-Stevens Point
Melvin J. Baughman, Extension Forester, Retired, University of Minnesota
Reviewed and revised in 2019 by John DuPlissis and Matthew Russell
Good decisions require good information. An inventory of the woodland resources on your property is an important first step in developing a stewardship plan. Information gathered from the inventory provides you with a snapshot of the current condition and future potential of your woodlands.
Because woodlands are often viewed as a source of timber, a woodland inventory usually focuses on assessing trees as potential wood products. However, a woodland inventory is equally valuable for assessing wildlife habitat, planning trails for recreation, and understanding the quality of your soil and water resources. An inventory of your woodland should focus on what is most important to you and provide you with the information you need to make good decisions about the management of your land.
Your first step in conducting a woodland inventory should be to contract with a forestry professional to perform an inventory of your woodland. Since an inventory involves time and expense, your forester must know your goals for the property and what resources are most important to you. A woodland inventory may include these and other features:
- Tree measurements:
- Tree diameter
- Total tree height and merchantable height
- Tree defects and grade
- Tree volume and biomass
- Stand measurements:
- Stand volume
- Stocking
- Growth and yield tables
- Site quality:
- Site index
- Tree quality
- Understory plant indicators
After analyzing this information, your forester will offer management alternatives for each stand. Knowing what is physically possible and financially realistic, you can select the management strategies that best meet your goals and resources.
Tree Measurements
Tree diameter, merchantable tree height, and grade can be used to determine the volume of useful wood in a tree.
Tree Diameter
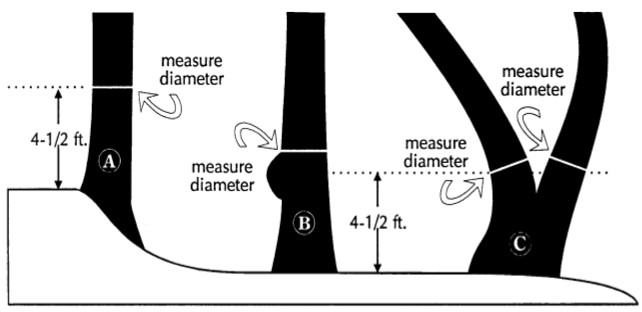
Tree diameter is measured on the main stem 4.5 feet above ground on the uphill side of a tree. This is referred to as diameter at breast height (DBH). A tree’s DBH usually is measured to the nearest inch using a steel diameter tape that is calibrated to permit direct tree diameter readings.
To measure tree diameter with a diameter tape, wrap the tape around the tree at breast height, perpendicular to the lean of the tree, standing on the uphill side of the tree (Figure 2-1). If there are branches or other protrusions at DBH, place the tape at the first unobstructed location above them. If the tree forks below DBH, consider each stem to be a separate tree and record separate measurements for each tree.
If you don’t have a diameter tape, measure tree circumference by wrapping a normal tape measure around the tree at breast height, then dividing the resulting circumference in inches by 3.14 (the mathematical value of pi) to determine DBH.
Tree Height
Total tree height is the distance in feet from the ground to the top of a tree. This height measurement is used mainly in conjunction with tree age to determine site quality, which is explained later in this chapter.
Merchantable tree height is the length of the main stem from the top of the expected stump to the upper limit of utilization in the tree. Stump height normally is 6 inches for softwood species and 12 inches for hardwood species, but varies depending on the volume table you use. The upper limit of utilization is where the main stem reaches a minimum usable top diameter, a main fork, or a serious defect such as a hole or a point of decay, or where excess limbs occur.
Standards for merchantability vary widely depending on local product markets. The usual minimum top diameter inside the bark (DIB) is 4 inches for pulpwood, 8 inches for sawlogs, and 10 inches for veneer logs. Merchantable tree height usually is measured in 8-foot lengths called half-logs, sticks, or bolts, but may be measured to the nearest 2 feet on high-value trees.
Tree Defects
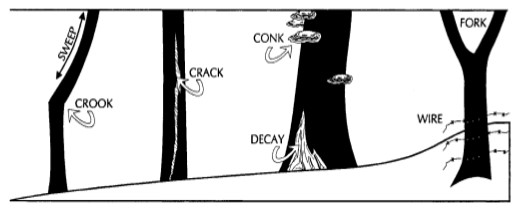
The main stem is the most useful part of a tree for conventional wood products such as pulpwood, posts, poles, and lumber. Defects that reduce the total volume of usable wood in the tree include sweep, crook, cracks, decay, forks, and embedded objects (Figure 2-2). Your forester will note the percentage of defect in each tree stem by product type. This percentage is then deducted from the overall estimate of tree volume. Because tree diameter decreases with increasing height in the tree, a defect occurring near the top of the tree will require a smaller percentage volume deduction than a similarly occurring defect near the base. Percentage deductions for tree defects are best estimated by a forester and recorded on a tally form. If the entire tree is unusable because of an excessive amount of defect, your forester will not measure it for wood products. This is a cull tree, and while not usable for wood products, it can be valuable for wildlife habitat.
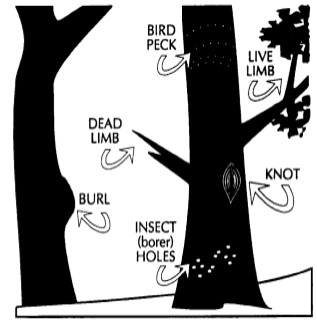
Defects such as burls, bird pecks, dead limbs, insect holes, live limbs, and knots will not affect the total volume of usable wood, but they will reduce wood quality, or grade (Figure 2-3). Tree grade influences the types of products that can be made from a tree and therefore the stumpage price. Higher grade trees have fewer defects.
Tree Volume
To estimate the wood volume of a tree’s stem, your forester will measure the tree diameter and merchantable height, then find the corresponding volume in a table.
Sawtimber and Veneer Trees
Trees that are large enough and of high enough quality to produce logs that can be sawed into lumber are referred to as sawtimber. To qualify as sawtimber, trees should have at least one 8-foot bolt, be at least 10 inches DBH, and have a top diameter inside bark (DIB) that is the larger of either 8 inches or 50 percent of DBH. For example, to be a sawlog, a tree of 20 inches DBH should have a minimum top DIB of 10 inches. These specifications are typical, but individual buyers may have different specifications. Sawtimber trees must not contain too many defects that reduce wood volume such as decay, scars, cracks, bulges, bark distortions, holes, branch stubs, or crook.
Individual trees of many species (such as black walnut, white ash, sugar maple, red oak, white oak) that are of exceptional quality, have at least one 8-foot bolt, are at least 16 inches DBH, and contain bolts that have a top DIB of at least 10 inches often can be sold as veneer trees. Logs harvested from these trees will be sliced or peeled into thin sheets. Veneer trees are more valuable than sawtimber.
| DBH in inches | Number of 16-foot logs | |||
|---|---|---|---|---|
| 1 | 2 | 3 | 4 | |
| Volume in board feet | ||||
| 10 | 35 | 60 | ||
| 11 | 45 | 75 | ||
| 12 | 55 | 90 | 120 | |
| 13 | 65 | 110 | 145 | |
| 14 | 80 | 130 | 175 | |
| 15 | 90 | 155 | 200 | |
| 16 | 180 | 240 | 285 | |
| 17 | 205 | 280 | 330 | |
| 18 | 235 | 315 | 375 | |
| 19 | 265 | 360 | 425 | |
| 20 | 295 | 400 | 480 | |
| 21 | 330 | 450 | 540 | |
| 22 | 370 | 500 | 605 | |
| 23 | 405 | 550 | 665 | |
| 24 | 440 | 605 | 725 | |
| 25 | 485 | 665 | 800 | |
The basic unit for estimating wood volume for both sawtimber and veneer trees is the board foot. A board foot is a piece of wood of any shape that contains 144 cubic inches of wood (for example, 12 inches by 12 inches by 1 inch, or 6 inches by 6 inches by 4 inches). Timber value is often described in dollars per thousand board feet (MBF).
Formulas called log and tree rules have been developed to estimate the number of board feet in a tree or log. A tree rule refers to a table that estimates wood volume in a standing tree. A log rule refers to a table that estimates wood volume in a cut log.
These rules differ in their assumptions about factors such as tree taper, board thickness, kerf (saw thickness), and minimum and maximum board width. They are never totally accurate, because:
- The assumptions on which they are based seldom occur.
- It is difficult to accurately measure volume losses from defects.
The International log rule (see Table 2-1) is one example of a log rule. For example, using this log rule a tree with a DBH of 22 inches with two 16-foot logs will yield 370 board feet. If the tree had a 10 percent defect then the total tree volume would be reduced to 333 board feet. On a volume per acre basis, a reasonable range of volume estimates is 1,000 to 15,000 board feet per acre.
Pulpwood
Trees that are too small or too poor in quality to be sold for sawlogs are often sold for pulpwood. Ultimately, these trees are chipped or ground up to manufacture products such as paper, hardboard, and various types of structural board.
Minimum DBH for pulpwood trees is 5 inches. Minimum DIB is the larger of either 4 inches or 50 percent of tree DBH. (The minimum DIB for a pulpwood tree with a DBH of 12 inches, therefore, is 6 inches.) In the Lake States pulpwood commonly is cut to 100-inch lengths.
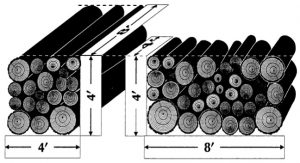
The basic unit for estimating pulpwood volume in trees is the cord. A standard cord is a closely stacked pile of logs containing 128 cubic feet of wood, bark, and air spaces between logs. A cord frequently is described as a stack of wood 8 feet long, 4 feet high, and 4 feet wide (Figure 2-4). The solid wood content (excluding bark and air space) of a cord varies from about 65 to 95 cubic feet depending on the diameter, roughness, and crookedness of the pieces. An accepted average value in the Lake States is 79 cubic feet of wood per cord.
Pulpwood also can be purchased by the ton. Different tree species have different wood densities. A 12-inch diameter red oak log will weigh much more than a 12-inch diameter aspen log because the oak log is much denser. For example, one cord of aspen weighs 2.4 tons, while one cord of red oak weighs 2.85 tons. Weight also varies depending on the season of the year because of the changing moisture content of logs.
| DBH in inches | Number of 8-foot bolts | |||||||
|---|---|---|---|---|---|---|---|---|
| 1 | 2 | 3 | 4 | 5 | 6 | 7 | 8 | |
| Volume in cords | ||||||||
| 5 | 0.01 | 0.02 | 0.03 | |||||
| 6 | 0.02 | 0.03 | 0.04 | 0.05 | 0.06 | |||
| 7 | 0.04 | 0.05 | 0.06 | 0.08 | 0.10 | 0.11 | ||
| 8 | 0.05 | 0.07 | 0.08 | 0.10 | 0.12 | 0.14 | 0.15 | |
| 9 | 0.06 | 0.08 | 0.10 | 0.12 | 0.15 | 0.17 | 0.20 | |
| 10 | 0.07 | 0.10 | 0.12 | 0.15 | 0.18 | 0.21 | 0.24 | |
| 11 | 0.09 | 0.12 | 0.15 | 0.18 | 0.22 | 0.26 | 0.29 | |
| 12 | 0.14 | 0.18 | 0.22 | 0.26 | 0.31 | 0.35 | ||
| 13 | 0.16 | 0.21 | 0.25 | 0.31 | 0.36 | 0.41 | ||
| 14 | 0.19 | 0.24 | 0.29 | 0.35 | 0.42 | 0.47 | ||
| 15 | 0.22 | 0.27 | 0.34 | 0.41 | 0.48 | 0.54 | ||
| 16 | 0.25 | 0.31 | 0.38 | 0.46 | 0.55 | 0.62 | ||
| 17 | 0.28 | 0.35 | 0.43 | 0.52 | 0.62 | 0.70 | ||
| 18 | 0.31 | 0.40 | 0.49 | 0.59 | 0.69 | 0.78 | ||
| 19 | 0.35 | 0.44 | 0.54 | 0.65 | 0.77 | 0.87 | ||
| 20 | 0.39 | 0.49 | 0.60 | 0.72 | 0.86 | 0.97 | ||
Woody Biomass
Woody biomass is the by-product of forest management activities or natural disturbances, including tree stems and their component parts (e.g., limbs and tops). Woody biomass is often used to produce energy. Buyers typically pay less for woody biomass than for veneer, sawtimber, and pulpwood; therefore, biomass usually is typically produced from small-diameter trees, branches, dead trees, downed logs, brush, and stumps. Biomass is commonly bought and sold on a tons-per-acre basis.
Stand Measurements
It is impossible to measure every tree in a stand, let alone an entire woodland. Each acre in a fully-stocked, mature woodland may have several hundred trees. Your forester will measure trees in sample plots and project those values to the whole stand. Sampling assumes that the measured trees represent all trees throughout the stand.
The number of sample plots needed is determined by the size of your woodland and the variability of tree species, sizes, and age classes. The number of sample plots generally will increase as the size of a property increases and as the number of the species, sizes, and age classes increases. If the trees contain highly valuable products, such as black walnut veneer, each tree containing that product may be measured. Your forester will determine the number of plots needed for management purposes in your woodland. Too many plots will waste time and money. Too few plots will yield imprecise estimates.
Sample plots should be randomly distributed across your property–not located in what appear to be “average” parts of your woodland or in those areas that are most convenient to reach. This is especially important on properties where tree size, species composition, and stand density vary.
Depending on the data to be collected, your forester may use fixed radius or variable radius plots. Fixed radius plots are circular plots that typically cover 1/10th acre (37.25 foot radius) or 1/5th acre (52.67 foot radius). Trees that fall within or on a fixed radius plot boundary can be included as part of the inventory. Fixed radius plots are generally used when inventorying all of the resources on your woodland property since they can be used to sample many stand attributes.
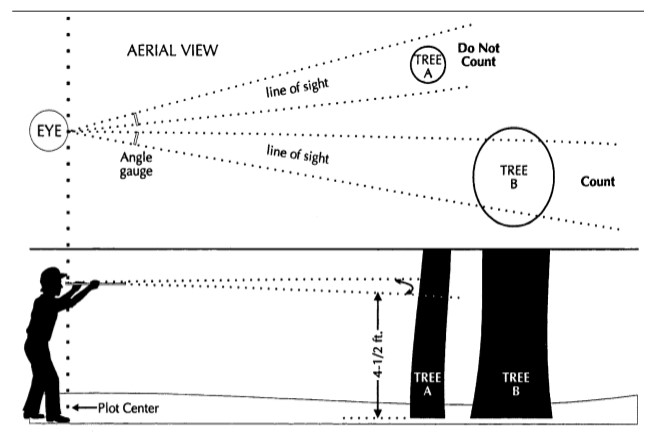
Variable radius plots are based on mathematical principles, but a simple wedge prism or angle gauge is used to determine which trees are in a plot (Figure 2-5). Such gauges work best in stands where trees are pole-sized or larger.
Stand Density
Stand density is a measure of tree crowding. A stand may be understocked (too few trees), fully stocked (just the right amount of trees) or overstocked (too many trees) for good tree growth. Stocking is a relative concept–a stand that is overstocked for one management objective may be understocked for another. Knowing your stand’s stocking level can help guide its management by helping you determine whether to let trees grow longer or to thin the stand now and provide more growing space around the residual crop trees. Foresters use several measures of stocking including basal area, stocking charts, and crown cover.
Basal Area
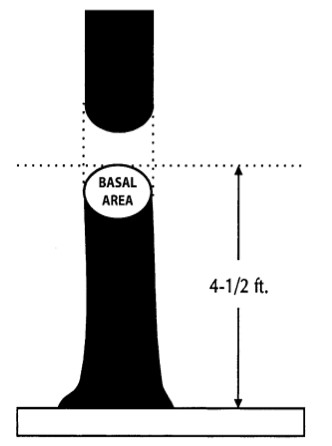
The basal area of a tree is the cross-sectional area of its main stem in square feet measured 4.5 feet above ground. Basal area per acre is the sum of cross-sectional areas (in square feet) of all trees on an acre (Figure 2-6). The optimum basal area for a stand depends on its species composition and tree size or age. (See some recommendations for specific for types in Chapter 6: Managing Important Forest Types.)
The wedge prism and angle gauge described in the Stand Measurements section can be used to measure basal area. When using a 10-factor wedge prism or angle gauge, count all the trees in the variable radius plot and multiply by 10 to determine basal area. For example, if there are 14 trees in a plot, multiply 14 by 10 to determine that the basal area is 140 square feet per acre. Take several basal area measurements and average them to determine the average basal area for a stand.
Stocking Chart
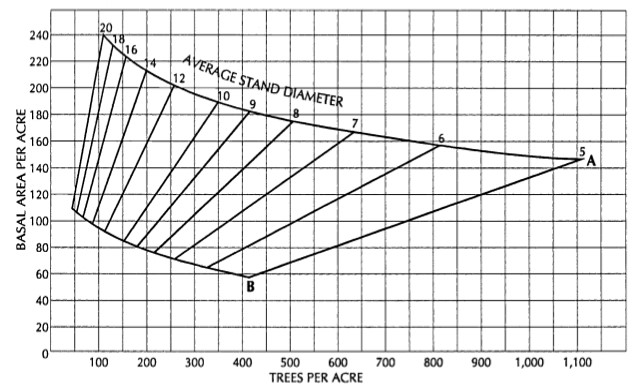
A stocking chart uses information about a stand’s basal area, trees per acre and their average diameter to recommend optimum stocking to sustain rapid tree growth. For example, Figure 2-7 is a stocking chart for red pine stands managed for maximum fiber production. Trees grow best when stocking is between the A and B lines. If a red pine stand had a basal area of 190 square feet and 350 trees per acre, those corresponding lines intersect at the A level. The closest average stand diameter is 10 inches. Follow the heavy black line for the 10-inch average stand diameter down to the B line and read the basal area and number of trees per acre at that point. We see that trees of this size would grow faster if the stand were thinned back to approximately 85 square feet of basal area and 160 trees per acre. But a forester would point out that cutting 45 percent of the stand to reach that level is too much to cut at one time. The rule of thumb is to cut no more than 33 percent of the stand at any one time. It will take two thinnings over time to reduce this stand to a stocking level where red pines grow best. A forester can help you understand stocking charts for your woodland and identify a target spacing for your stand.
Crown Cover
Crown cover refers to the percentage of sky area blocked by tree crowns when viewed from ground level. Some foresters use a mirror with grid lines on it to view the reflected canopy and measure crown cover, but most simply look upward at the sky from each plot center and estimate crown cover. Crown cover is used as a measure of stand density, particularly when designing specific kinds of harvests.
Site Quality
As part of a woodland inventory, site quality should be evaluated to help predict how well important tree species will grow. The rate that a tree grows depends partly on genetic characteristics and partly on site factors, including soil fertility and texture, moisture, climate, slope, and aspect (direction a slope faces). To judge site quality, foresters will use soil maps, evaluate the condition of existing trees, measure site index based on tree age and height, and/or identify understory plants indicating site quality.
Tree Quality
Experienced foresters know what a good quality tree of a particular species should look like on a good site. Mature trees on good sites tend to be taller, have straighter stems, fewer limbs on main stems, and long merchantable stem heights, compared to trees of the same species on poor sites. When a majority of mature trees on a site exhibit desirable characteristics, a forester would judge that site to be good quality.
The difficulty in judging site quality by the condition of existing trees is that a stand with poor quality trees may not indicate a poor site. Trees may be poor because the best quality trees were harvested through repeated cuts (high-grading), leaving trees that were genetically inferior or damaged. A stand may have been lightly stocked at one time and pastured. Open grown trees develop short stems with large crowns, but their poor quality appearance may be due to low stocking density, not to site quality. Previous wind or ice damage also may have damaged crowns of trees throughout a stand, leaving trees in poor condition.
Site Index
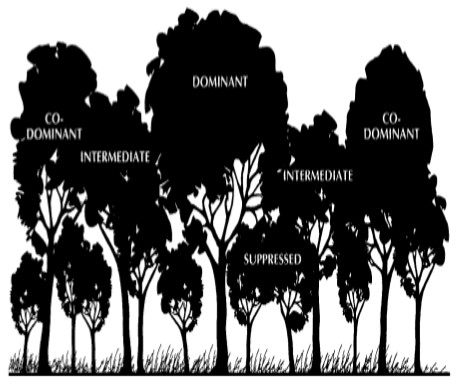
Foresters often judge site quality based on the total height that dominant and co-dominant trees will grow in a given time–usually 50 years in the Lake States. Trees are expected to grow taller on good sites than on poor ones in the same time period. This measure of site quality is called site index. Site index curves have been constructed for many tree species so that site quality may be determined for a stand of trees larger than saplings if average tree age and average total tree height are known.
Tree Age
Age is often measured on dominant or co-dominant trees (Figure 2-8) of a species that is to be favored by management and is common on the property.
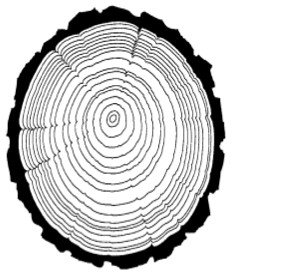
If trees were planted in your woodland, look for records showing the year of planting to determine tree age. If some plantation trees were recently harvested, count the annual growth rings on a stump or log (Figure 2-9).
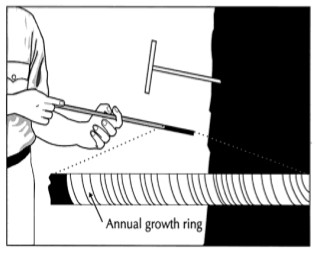
To measure the age of a living tree without cutting it down to count rings, you can take a core sample at 4.5 feet above the ground using an increment borer (Figure 2-10). An increment borer is similar to a hand drill, but has a hollow drill bit. It extracts a core of wood about the size and shape of a pencil. This core shows annual growth rings as bands of light and dark wood. By counting the rings in the core and adding the number of years it took the tree to grow to a height of 4.5 feet, your forester can determine tree age.
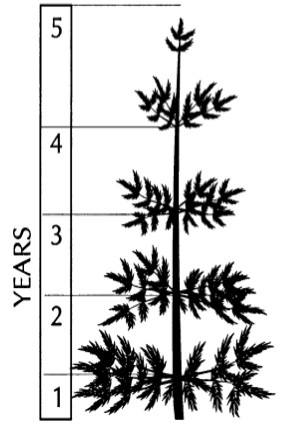
The age of conifers such as red (Norway) pine, white pine, and balsam fir that produce one whorl of new branches each year can be estimated by counting whorls (Figure 2-11). This approach works best when the trees are young (<25 years) because it is easier to see each whorl. False whorls can develop if more than one spurt of growth occurs in a year.
Site Index Curves
If you know the average tree age and total tree height of a tree species of primary interest, refer to a set of site index curves for that species to determine site quality. As an example, site index curves for red pine are shown in Figure 2-12. These curves were developed for use in pure, even-aged stands of red pine. A pure stand is one in which at least 80 percent of the trees are of the same species. An even-aged stand is one where the age difference between the youngest and oldest tree in a stand does not exceed 20 percent of the projected rotation length. A rotation is the number of years required to establish and grow trees to a specified size, product, or condition of maturity at which they can be harvested.
For example, if you measured several dominant and co-dominant red pines and determined their average age was 80 years and average total tree height was 90 feet, find 80 years on the bottom axis in Figure 2-12, then follow the vertical line upward from that point until it intersects the 90-foot level on the left vertical axis. Now follow the site index curve from the junction of those two lines to the right vertical axis, where you will find that the site index is approximately 65. These trees would be expected to be 65 feet tall at age 50. The higher the site index, the better the site. Your forester can help you identify site index curves for tree species growing in your woodland.
Vegetation as Indicators of Site Quality
A native plant community is a group of native plants that interact with each other and with their environment. These groups of native plant species form recognizable units, such as oak savannas, pine forests, or marshes, that tend to repeat over space and time. Native plant communities are classified and described by considering vegetation, hydrology, landforms, soils, and natural disturbance regimes. Examples of natural disturbances include wildfires, severe droughts, windstorms, and floods. Some native plant communities, such as forested peatlands, are less productive and a lower quality site than others, such as mesic hardwood forests, due to the availability of water and nutrients, among other factors.
Foresters use associations of understory plants to indicate site quality for particular tree species. Some understory plants grow on a wide range of sites, but those with more specific site requirements (for example, in moisture and nutrients) are used for site classification. Understory plants tend to persist on sites regardless of past timber management, and the presence of a particular combination of understory species can indicate how well particular tree species will grow, even if those tree species are not currently found on a site. For example, if a combination of understory plants in north-central Wisconsin indicates a very dry to dry, nutrient poor site, a forester knows that site is best suited for growing jack pine, red pine, white pine, oaks, and red maple. Tree growth may not be particularly good on this poor site, but these tree species are the best adapted to it.
Growth and Yield Tables
Yield tables have been developed for some commercially important tree species showing the estimated volume of wood per acre that could be grown at different stand ages. Such tables usually estimate expected volumes in pure, even-aged stands on sites of different quality as measured by site index. Table 2-3 is a yield table for red pine. If you owned an even-aged red pine stand with a site index of 65, current stand age of 80 years, and basal area of 120 square feet, you could expect to have a volume of approximately 42.3 cords per acre. There also are computer programs that predict growth and yield at different stand ages based on inventory information.
Yield information can also be used as a basis for financial analyses of different investment alternatives. Yield tables are not always accurate, but are helpful for comparisons. Your forester may be able to provide growth and yield information for your woodland.
| Total age (years) | Total height (feet) | Basal area per acre (trees 3.6 inches and larger) | |||||
|---|---|---|---|---|---|---|---|
| 30 | 60 | 90 | 120 | 150 | 180 | ||
| Cords per acre | |||||||
| Site index = 75 | |||||||
| 40 | 61 | 7.2 | 14.5 | 21.7 | 29.0 | 36.2 | 43.5 |
| 60 | 86 | 10.2 | 20.4 | 30.6 | 40.8 | 51.0 | 61.3 |
| 80 | 103 | 12.2 | 24.5 | 36.7 | 48.9 | 61.2 | 73.4 |
| 100 | 115 | 13.6 | 27.3 | 41.0 | 54.6 | 68.3 | 81.9 |
| 120 | 124 | 14.7 | 29.4 | 44.2 | 58.9 | 73.6 | 88.3 |
| 140 | 130 | 15.4 | 30.9 | 46.3 | 61.7 | 77.2 | 92.6 |
| 160 | 134 | 15.9 | 31.8 | 47.7 | 63.6 | 79.6 | 95.5 |
| Site index = 65 | |||||||
| 40 | 53 | 6.3 | 12.6 | 18.9 | 25.2 | 31.5 | 37.8 |
| 60 | 74 | 8.8 | 17.6 | 26.4 | 35.1 | 43.9 | 52.7 |
| 80 | 89 | 10.6 | 21.1 | 31.7 | 42.3 | 52.8 | 63.4 |
| 100 | 100 | 11.9 | 23.7 | 35.6 | 47.5 | 59.4 | 71.2 |
| 120 | 107 | 12.7 | 25.4 | 38.1 | 50.8 | 63.5 | 76.2 |
| 140 | 112 | 13.3 | 26.6 | 39.9 | 53.2 | 66.5 | 79.8 |
| 160 | 116 | 13.8 | 27.5 | 41.3 | 55.1 | 68.9 | 82.6 |
| Site index = 55 | |||||||
| 40 | 45 | 5.3 | 10.7 | 16.0 | 21.4 | 26.7 | 32.0 |
| 60 | 63 | 7.5 | 15.0 | 22.4 | 29.9 | 37.4 | 44.9 |
| 80 | 76 | 9.0 | 18.0 | 27.1 | 36.1 | 45.1 | 54.1 |
| 100 | 85 | 10.1 | 20.2 | 30.3 | 40.4 | 50.5 | 60.5 |
| 120 | 91 | 10.8 | 21.6 | 32.4 | 43.2 | 54.0 | 64.8 |
| 140 | 95 | 11.3 | 22.6 | 33.8 | 45.1 | 56.4 | 67.7 |
| 160 | 98 | 11.6 | 23.3 | 34.9 | 46.5 | 58.2 | 69.8 |
Conclusion
Like many processes, if you don’t measure it, you can’t manage it. This goes for your woodland also. Having an inventory of your property is an important first step in developing a stewardship plan. An inventory of your woodland should focus on what is most important to you and provide you with the information you need to make good decisions about the management of your land.
A forestry professional can help in designing and performing an inventory of your woodland. For your reference, you may find helpful Appendices A and B which list some useful forest measurements and conversions and provide sample tally sheets for conducting a woodland inventory.
