6.2 Selecting Software
Learning Objectives
- Identify the types of software that are appropriate for projects of low complexity.
- Identify the types of software that are appropriate for projects of medium complexity.
- Identify the types of software that are appropriate for projects of high complexity.
- Describe strategies for sharing documents that can be edited by a team.
Part of a communications plan is determining the type of computer software that will be used to create documents, spreadsheets, diagrams, and reports. The choice of software is related to the complexity of the project.
Simple Projects
Basic projects can be managed using some of the features available in general-purpose software that is available in most offices.
Word Processing
Even the most basic project will generate numerous documents using word processing software. A communications plan can specify standards for these documents that makes it easier to create, edit, combine, store, and retrieve the documents. Document standards include the following:
- Specifying the file format
- Using templates for commonly used forms
File Format
Word processing software programs display a document on a computer’s screen and allow the user to enter and edit text. When the file is saved to a storage device, the text and all the various formatting such as font and font size are converted to a code for efficient storage. The code varies from one word processing program to another and even between releases of the same program.
The most common word processing program, by a wide margin, is Microsoft Word (MS Word). Several releases of MS Word run on the Windows operating system and on the Macintosh operating system. Versions of MS Word released prior to 2007 save files in a proprietary format. The format is indicated by a period and a three-letter extension—.doc—that is automatically attached to the file when it is saved. Beginning with MS Word 2007 for Windows and MS Word 2008 for Macintosh, files are saved using a different format that is indicated by a period and a four-letter extension—.docx—that identify the newer format.
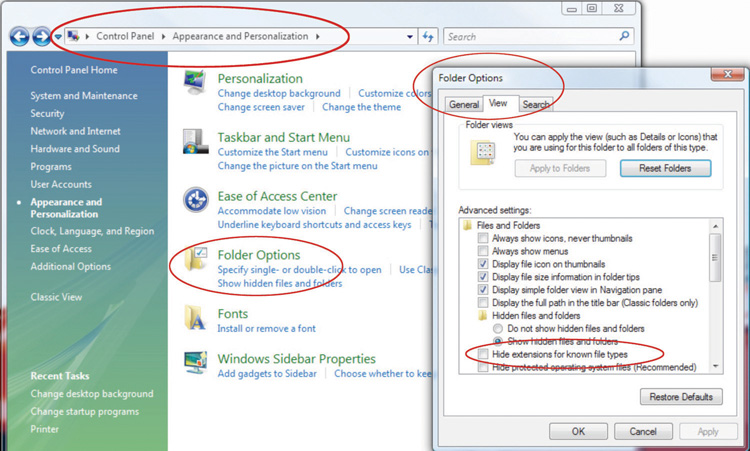
Almost all word processing programs have the ability to save files in the .doc file format, and it is a common standard for word processing files. Newer versions of word processing programs, including MS Word 2007 and MS Word for Mac 2008, can save files in the older .doc format. There are new features in MS Word 2007—such as the ability to format citations in a variety of styles, including APA, MLA, and Chicago—that are lost when the file is saved in the .doc format. Older versions of MS Word can be adapted to read the newer .docx file formats by downloading and installing a compatibility program that is available at no cost from Microsoft’s Web site. Display of document file extensions is hidden by default in the Windows operating system. They can be displayed by turning off this feature. Instructions for displaying the file extensions are available from the operating system’s help menu. In the Windows Vista operating system, the option is found on the Control Panel, in Appearance and Personalization, in Folder Options, on the View tab, under Advanced Settings, as shown in Figure 6.8 “Displaying File Name Extensions”.
Figure 6.8 Displaying File Name Extensions
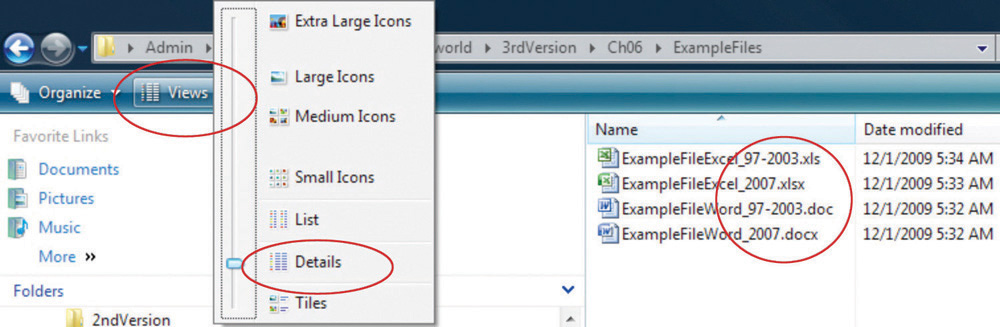
When a list of files is displayed in a dialog box, choose the Details option. In Windows Vista, the Details option is on the View button, as shown in Figure 6.9 “File Extensions Displayed in Details View”.
Figure 6.9 File Extensions Displayed in Details View
Styles
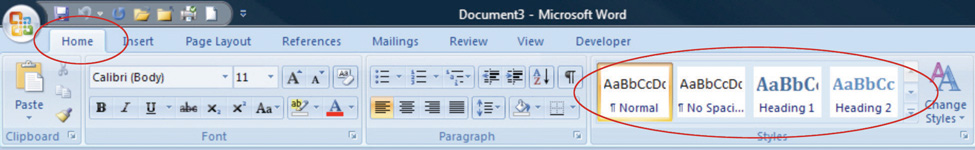
The combination of formatting, including font, font size, font color, shading, and other attributes used to display a segment of text and to identify its level of importance, is called a style. A style can be given a name and applied repeatedly to different portions of a document. Predefined styles are available in MS Word 2007 on the ribbon, on the Home tab, in the Styles group, as shown in Figure 6.10 “Style Choices”. Users can define their own styles and give them names. Some organizations prefer that all of their documents have similar fonts and styles for headings, body text, and figure captions.
Figure 6.10 Style Choices
Outlines
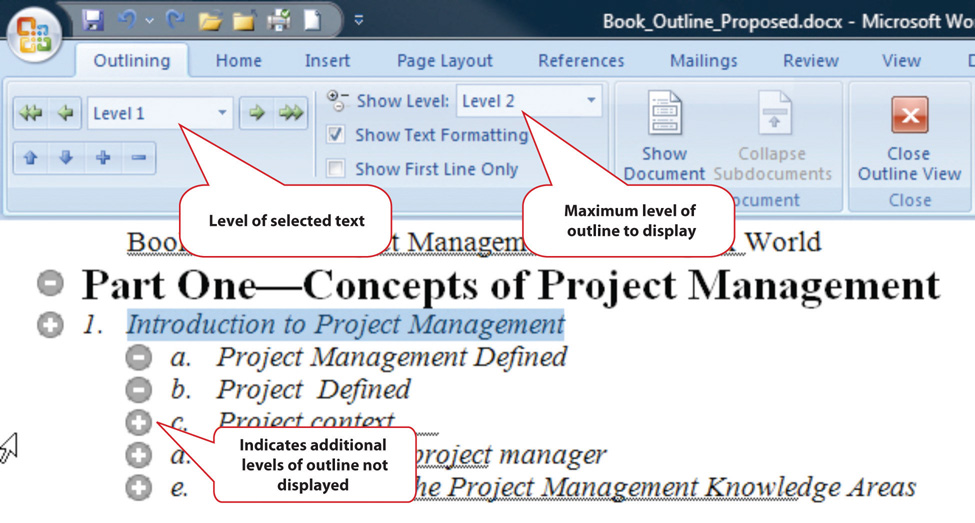
An outline of a document consists of topic headings and subheadings, and it is useful when organizing or reorganizing a document. The Styles group in MS Word 2007 includes predefined styles for nine levels of headings. In addition to using different fonts, each heading is assigned a level of importance. A document that uses headings with assigned levels can be viewed in the Outline view, such as the book outline shown in Figure 6.11 “Outline View in MS Word 2007”. In this view, the level of detail displayed in the outline is selected to display the first two levels of the outline. The headings and the hidden text associated with each heading can be moved by selecting and dragging headings from one location in the outline to another.
Figure 6.11 Outline View in MS Word 2007
Templates
If a particular type of document will be used repeatedly, it might be worth the time to create an example document—a template—that is formatted using the appropriate styles with blanks or placeholder text where the user can insert the information that describes a particular situation. A variety of templates are already available for download at no additional cost. For example, when a new document is created in Microsoft Word 2007, there is an option to choose a template such as the invoice template shown in Figure 6.12 “Standardized Document Used as a Template”.
Figure 6.12 Standardized Document Used as a Template
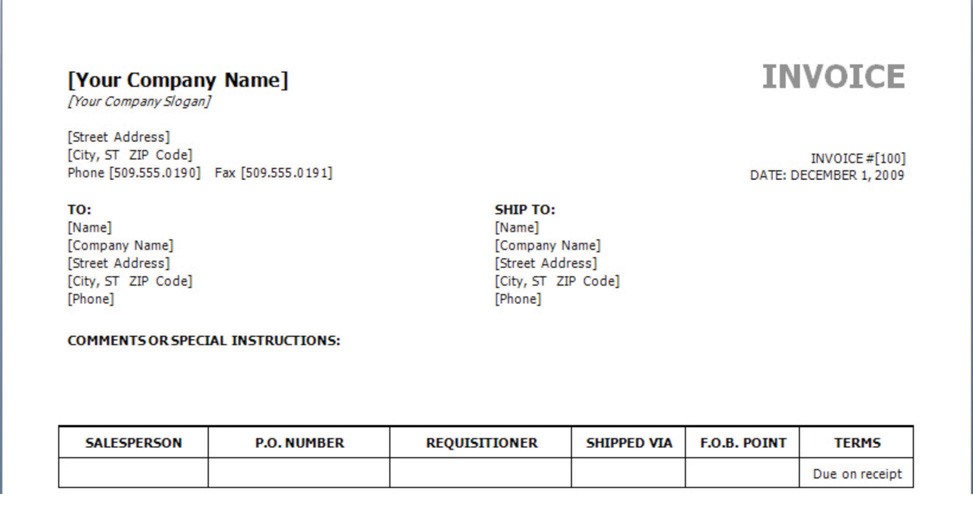
The template may be customized and used repeatedly for all the documents of that type, or the organization can design its own.
Diagrams
Reporting relationships and the flow of work are often described using diagrams that consist of boxes connected by arrows. Recent releases of popular word processing programs include drawing tools that can be used for basic diagrams. In MS Word 2007, a variety of shapes and connectors are available on the Insert tab, in the Illustrations group on the Shapes button, as shown in Figure 6.13 “Menu of Diagramming Shapes and Connectors in Word 2007”.
Figure 6.13 Menu of Diagramming Shapes and Connectors in Word 2007
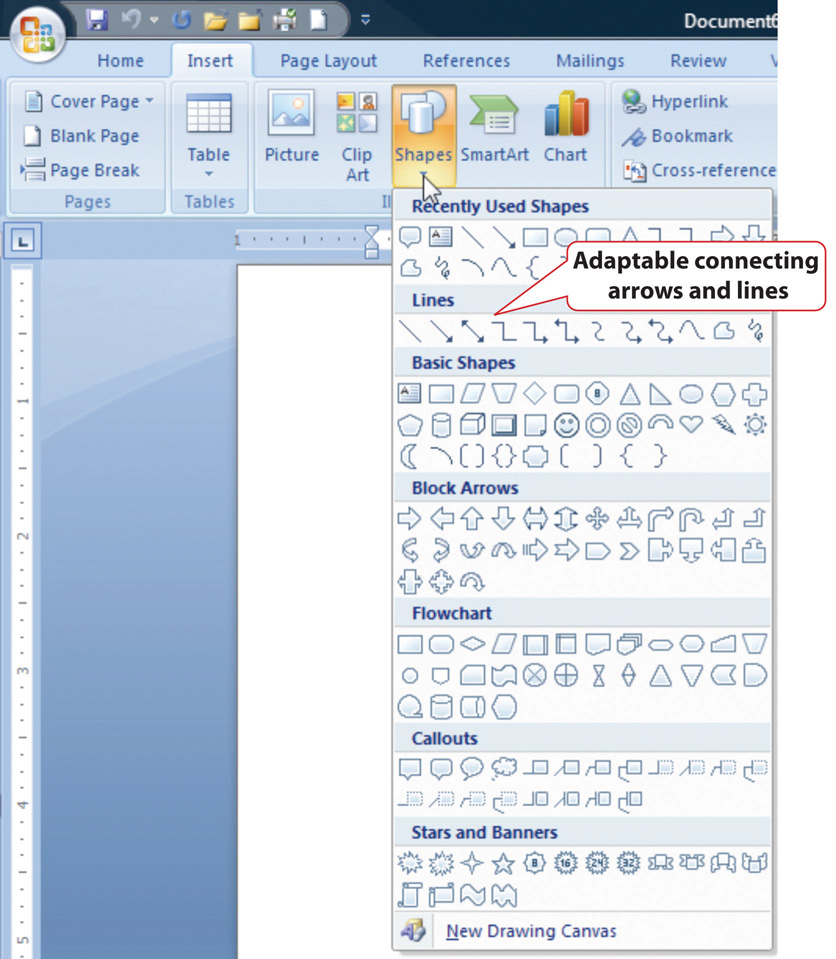
Adaptable connecting lines and arrows can be used that redraw automatically when the shapes are moved. This feature facilitates rapid revisions when the shapes must be moved, because the connecting arrows do not need to be redrawn.
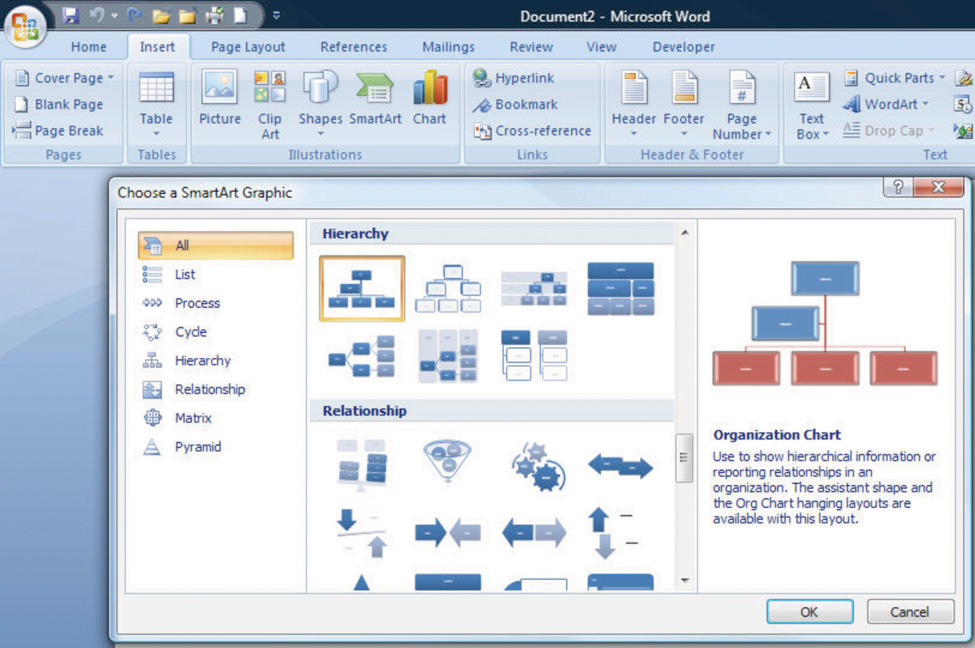
A feature named SmartArt was introduced in Microsoft Office 2007 that has a variety of charts that can be used for displaying organization and relationships that use more sophisticated and artistic graphics, as shown in Figure 6.14 “SmartArt Feature in Microsoft Word”.
Figure 6.14 SmartArt Feature in Microsoft Word
Spreadsheets
Another commonly available software creates a spreadsheet—a display of data in row and column format—in which financial or numerical data can be manipulated. The intersection of the rows and columns are cells into which numbers, text, dates, and formulas can be entered. The formulas can utilize values found in other cells and display the results in the cell in place of the formula. If the value in a cell to which the formula refers is changed, all the formulas that use that cell’s value are immediately recalculated. This feature makes it convenient to examine several options quickly. Spreadsheets are often used to manage data on simple projects instead of a dedicated database or project management software.
Organizing Data in Rows and Columns
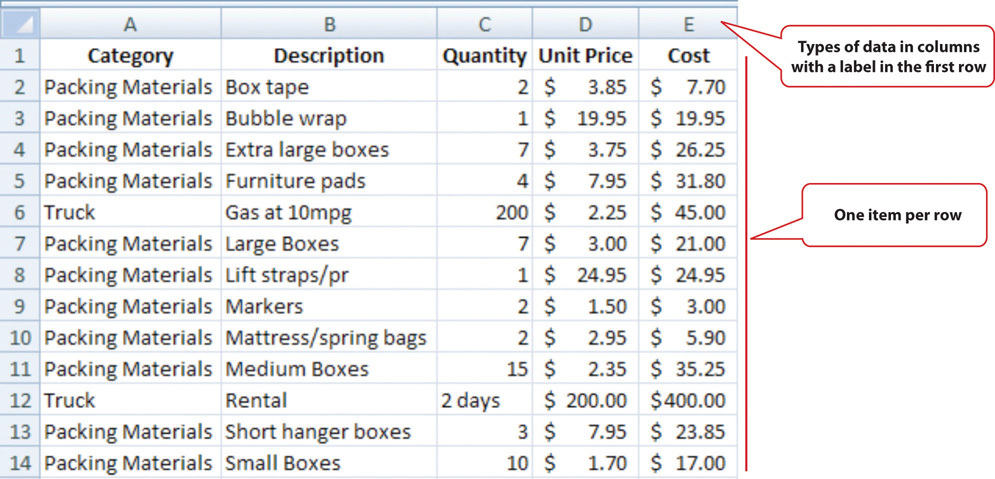
If a spreadsheet is used to store data, such as a list of project activities or a list of expenses, it is prudent to arrange the data in some way that would be used by more sophisticated data management software. Most data management programs arrange data in such a way that each type of data is represented by a column with a label at the top and each row contains the specific data for one type of item. A collection of data arranged in rows and columns is a table. For example, a list of expenses would be arranged so that individual expenses are recorded on each row, and each column would be a type of information related to the expenses, as shown in Figure 6.15 “Expenses Arranged in a Table in a Spreadsheet”.
Figure 6.15 Expenses Arranged in a Table in a Spreadsheet
File Format
The most common spreadsheet program, by a wide margin, is Microsoft Excel (MS Excel). There have been several releases of MS Excel that run on the Windows operating system and on the Macintosh operating system. Versions of MS Excel released prior to 2007 save files in a proprietary format. The format is indicated by a period and a three-letter extension—.xls—that is automatically attached to the file when it is saved. Beginning with MS Excel 2007 for Windows and MS Excel 2008 for Macintosh, files are saved using a different format that is indicated by a period and a four-letter extension—.xlsx—that identifies the newer format.
Almost all spreadsheet programs have the ability to save files in the .xls file format, and it is a common standard for spreadsheet files. Newer versions of spreadsheet programs, including MS Excel 2007 and MS Excel for Mac 2008 can save files in the older .xls format. There are a few new basic features in MS Excel 2007 that would be lost by saving files to the older file format.
Using a Spreadsheet to Manage Project Data
If the data in the spreadsheet is arranged in simple rows of the same type of data, it can be manipulated to provide reports for basic projects.
If one or more of the columns in a table contain labels, identification numbers, or other descriptions, those labels can be used to specify sorting and filtering options. For example, if the spreadsheet has a list of expenses, the rows of data can be sorted in decreasing or increasing value by one of the data types such as the due date or the amount of the expense. The display can be restricted—filtered—to display only those rows that meet criteria specified by the user. For example, the table could be filtered to display the expenses for a particular department that were incurred between two dates. This ability facilitates the preparation of monthly progress reports and budgets.
In MS Excel 2007, the sorting and filtering options are on the Data tab, in the Sort and Filter group under the Sort or Filter button. Once a filter is applied, option buttons are placed at the top of each column to facilitate changes in the sorting or filtering options. For example, the list of expenses shown in the previous figure can be sorted by the labels in the Category column and filtered to show only costs that are more than $20, as shown in Figure 6.16 “Sorting and Filtering in Microsoft Excel 2007”.
Figure 6.16 Sorting and Filtering in Microsoft Excel 2007

Subtotals
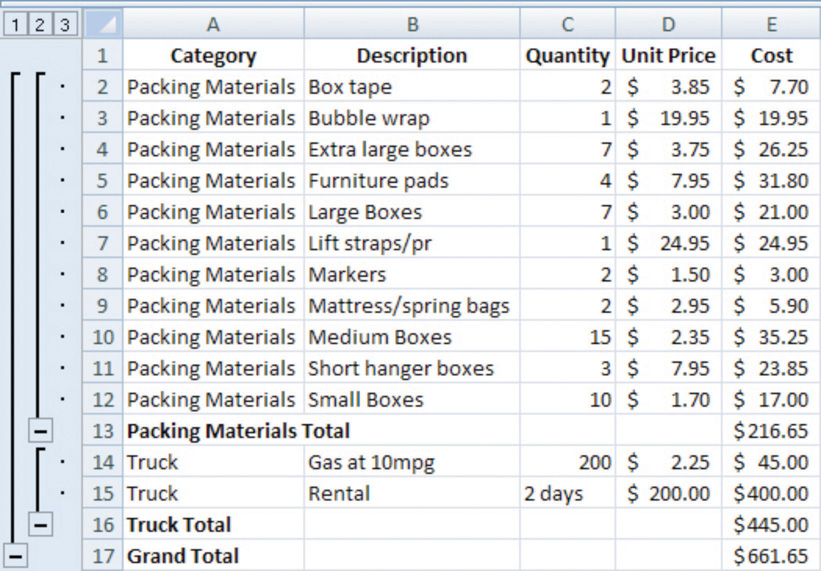
If the user wants to find a subtotal of the values that belong in a particular group, the groups must be identified by a label in one of the columns. Finding subtotals is a two-step process. First, the table is sorted by that column to bring all the rows in each group together. Next, the subtotal feature is applied. In Excel 2007, the subtotal option is found on the Data tab, in the Outline group. A dialog box allows the user to choose the columns to subtotal and the columns that contain the labels of the groups. A subtotal is inserted below the last row for each group, as shown in Figure 6.17 “Using Subtotals”.
Figure 6.17 Using Subtotals
In a panel at the left of the screen are lines and symbols that indicate the level of detail that is displayed. By clicking on the boxes with minus signs, the rows containing the data can be hidden, leaving the subtotals or grand total, as shown in Figure 6.18 and Figure 6.19. This feature allows a manager to view summary data very quickly without the visual clutter of the details.
Figure 6.18
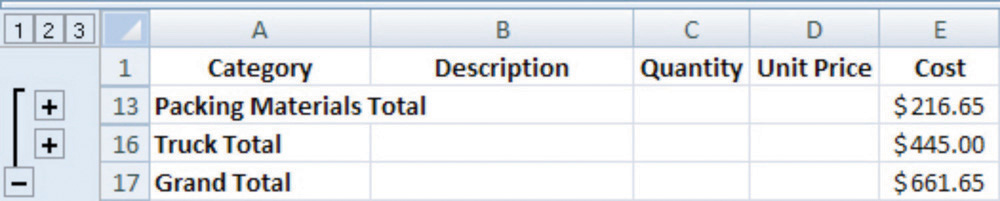
Third level details are hidden.
Figure 6.19
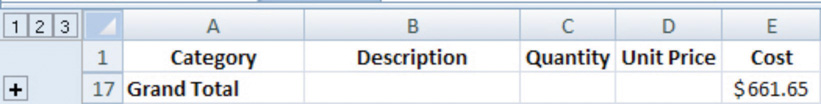
All details in rows 2–16 are hidden.
Graphics for Bar Charts and Milestones
Spreadsheets can be used for basic progress reports that show activities, dates, and horizontal bars that represent the duration of an activity. A sequence of dates can be created as column labels by entering the first two dates in the sequence, selecting both dates, and then dragging the fill handle—a small square in the lower right corner of the selected cell, as shown in Figure 6.20 “Creating a Sequence of Dates”—to extend the pattern.
Figure 6.20 Creating a Sequence of Dates
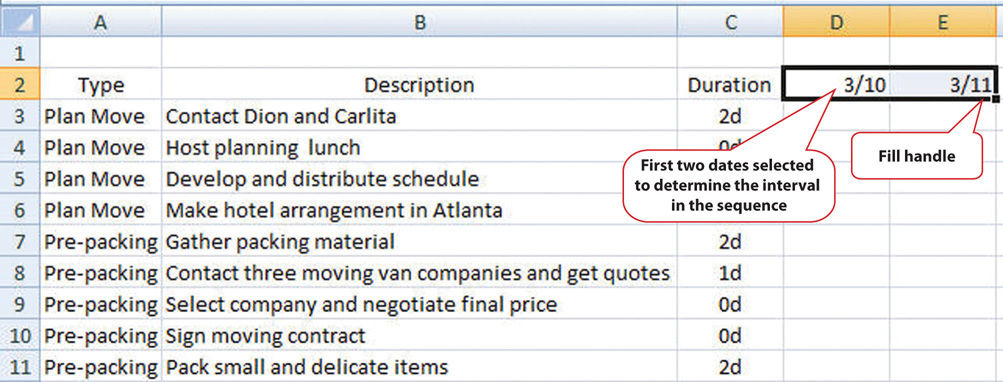
The program is sophisticated enough to correctly fill date sequences between months that have a different number of days and even account for leap years in February. Because more sophisticated project management software uses a table design in which the first two columns are description and duration, a similar structure, in which those two columns are adjacent and in that order will make it convenient to transfer the list of activities in a low-complexity project into the project management software at a later date if the spreadsheet is not sufficient. In the duration column, use the following abbreviations:
- d for days
- wk for weeks
- mons for months
The duration of each activity and the relationships between activities can be illustrated using the drawing shapes. In Excel 2007, the same set of shapes and connector arrows are available as those in Word 2007. A long rectangle can represent a bar whose length represents the duration of the activity. Events or significant dates in the project are identified with a diamond. The diamond can be created by using a small square shape and rotating it. Arrows can be drawn between the shapes to indicate their relationships, as shown in Figure 6.21 “Diagram of Activities”. Unfortunately, the arrows in Excel 2007 connect to handles on the sides of the rotated squares instead of the corners. This detail may be overlooked in a simple project diagram.
Figure 6.21 Diagram of Activities
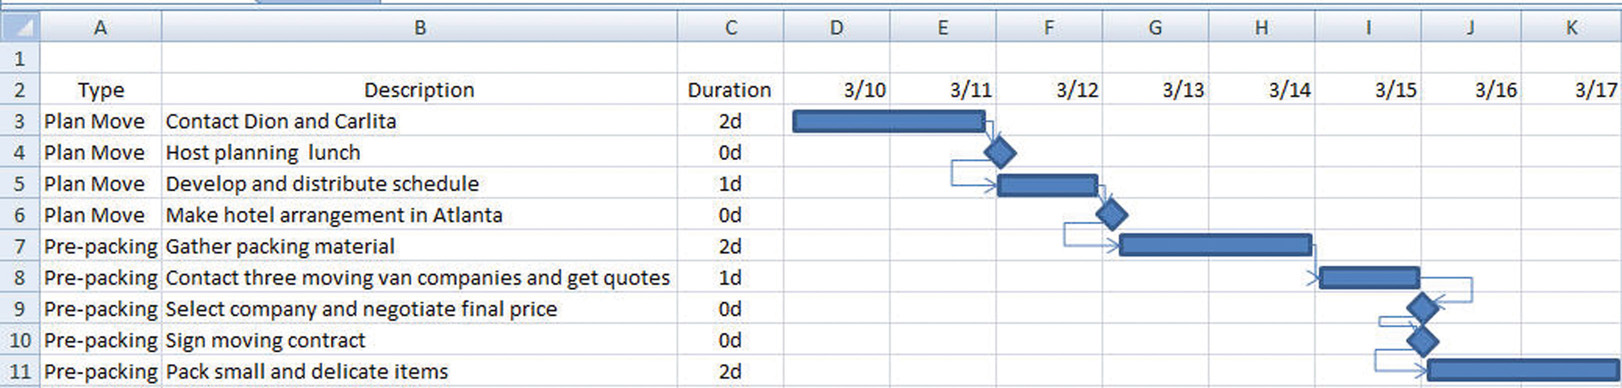
This type of diagram is useful for projects with low complexity where a simple chart of a few activities will suffice.
Software for Moderately Complex Projects
More complex projects involve more people who are often separated geographically and who contribute to the same documents. Complex projects have more tasks with more complex relationships. To manage those tasks and relationships, using dedicated project management software and more sophisticated diagramming software is justified.
Sharing Team Documents
If more than one person on a team will be contributing to a document, the document must be accessible to them. To manage documents that are created by a team, it is necessary to control the edits so that work is not lost or confused.
Version Control
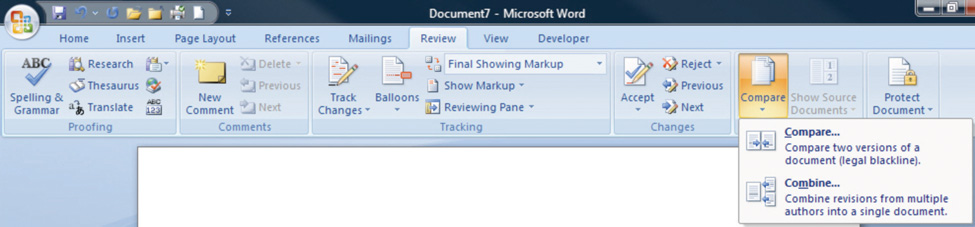
Files such as word processing documents and spreadsheets may be stored on an individual’s computer and copies sent to participants who then make changes and return the revised version to the person who is responsible for the final version of the document. If more than one person is editing his or her own copy of a document at the same time, different versions of the document with different additions or corrections are created. Word processing programs such as MS Word 2007 have a feature that can compare two documents and identify the differences to help bring the two different documents back together. This feature is found on the Review tab, in the Compare group, as shown in Figure 6.22 “Compare Documents Feature”.
Figure 6.22 Compare Documents Feature
Most software programs make periodic backups to protect from accidental power loss. One of the ways that a user can still lose a lot of work is by replacing a newer version of a document with an older version. It is possible to display the date on which the file was last saved using the Details view. If more than one version of the file exists in two different locations, the dates can be compared to determine which is the most recent. These techniques are useful for simple projects with very few participants.
File Storage and Access Control
Managing versions of documents that are edited by more than one person can be done more effectively by placing the file in a location that can be accessed by all the team members. This can be a shared drive on the company’s computer or on a document sharing service. People who need to use the document are grouped by their need for access. Three groupings are common:
- View only
- Edit only
- Ownership/administrator
The owner or administrator of the document can set the access levels. These levels of access can be assigned to each individual, or they can be assigned to named groups and the person can be made a member of a group. The owner of the document can choose to accept or reject changes made by those with edit-only permission.
The advantage of this method is that there is only one version of the file. If a file is being edited, it is usually locked so that other team members may view the file but cannot edit it until the first editor closes the file.
If the file is stored on a computer that is on a secure network within an organization, it can be difficult for team members who do not have direct connections to the company’s network to get access to the files. To protect the security of the company’s network, the network administrator can grant an outside user permission to access the network from anywhere on the Internet using a virtual private network (VPN) connection. A VPN uses encryption—replacing readable content with a code—to protect the communication between the network and the user to make it secure. The VPN connection gets the user onto the company network as if they were directly connected, but they still need the appropriate passwords to access the shared documents.
Tracking Changes and Adding Comments
One of the features that is particularly useful for keeping track of the changes made to a document by several users is called Track Changes. In Microsoft Word 2007, it is found on the Review tab, in the Tracking group. Changes may be shown in the document or in balloons at the side.
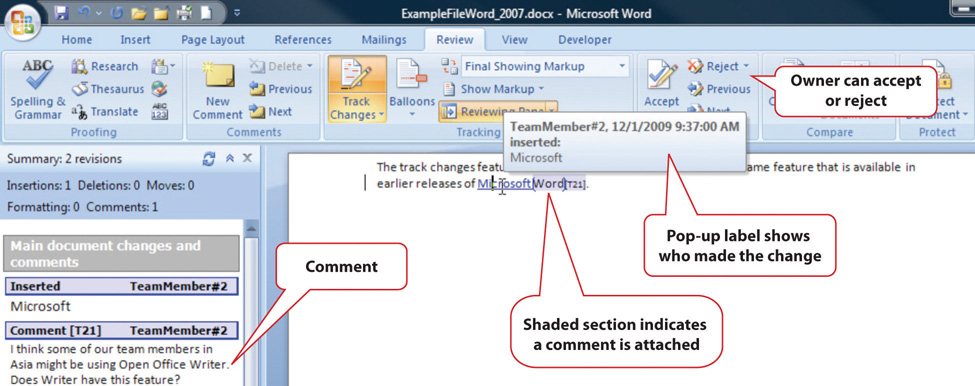
If a team member wishes to explain a change, it is very important that they do not insert their explanation as text into the document. Such explanations might not be deleted and would end up in the final version of the document with potentially damaging results. Instead, team members can use a form of electronic sticky note to make comments. This feature is found in MS Word 2007 on the Review tab, in the Comments group. A change and a comment are shown in Figure 6.23 “Tracking Changes and Adding Comments”. The document owner must go through the document and accept or reject each change and delete all the comments before the document is released as a finished product. The Next, Accept, and Reject options are found in Microsoft Word 2007 on the Review tab, in the Changes group.
Figure 6.23 Tracking Changes and Adding Comments
Diagramming Software
The processes and relationships in medium- and high-complexity projects usually require more sophisticated software tools for creating reporting diagrams and workflow charts. The market for diagramming software is more diverse than for word processing and spreadsheets, and it is not as likely that most team members will have the same programs that save files in the same formats. Microsoft Viseo 2007 is available as a stand-alone program that sells for several hundred dollars. For medium-complexity projects, a free alternative to Viseo is Open Office Draw. Open Office is a free software alternative that includes a word processing, spreadsheet, presentation, and drawing programs. The Open Office Draw program, and others like it, can create diagrams such as the one shown in Figure 6.24 “Diagram Created Using Open Office Draw”.
Figure 6.24 Diagram Created Using Open Office Draw
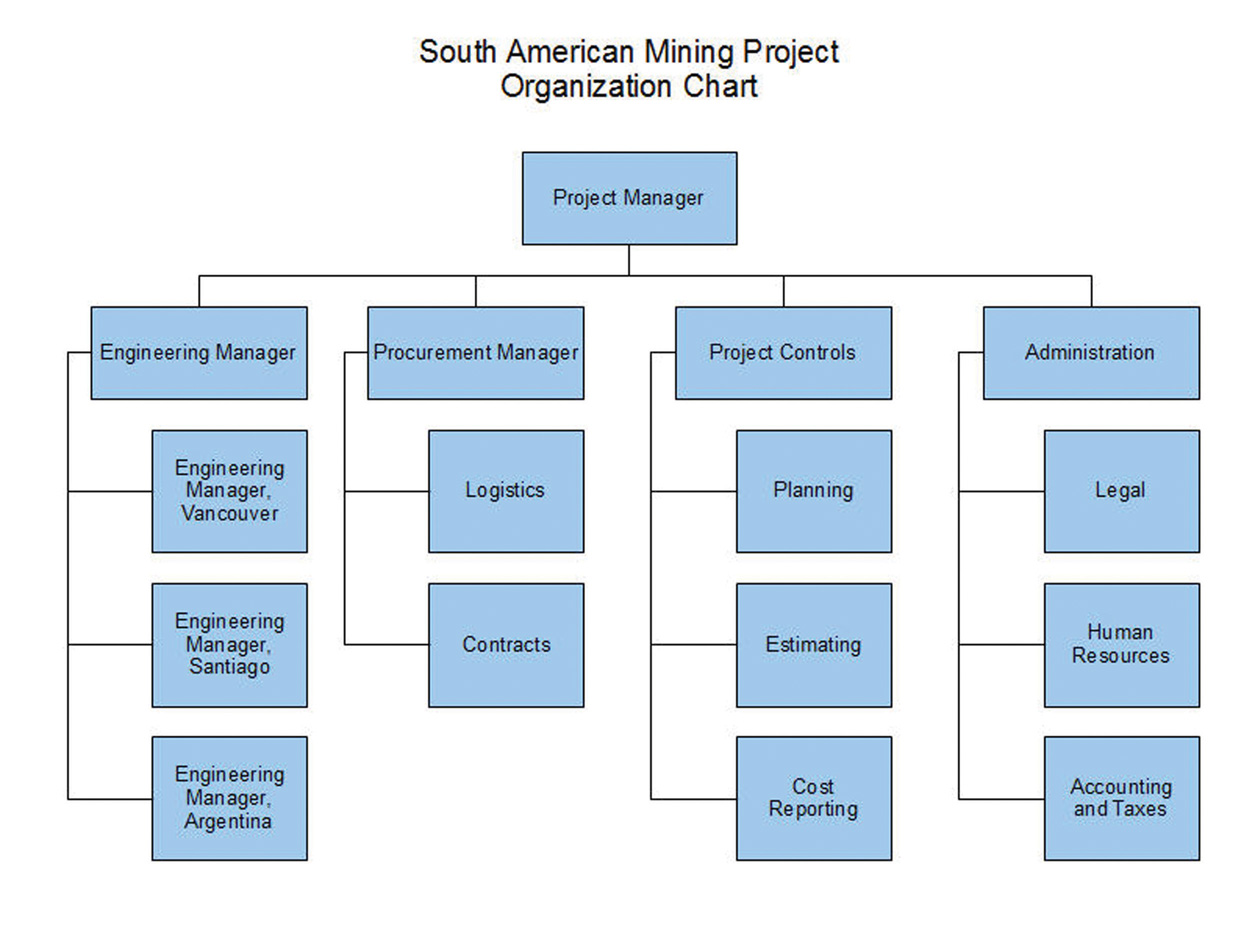
The files created by the various drawing programs might not be compatible with each other, but all the programs can create static image files that can be pasted into word processing documents.
Project Management Software
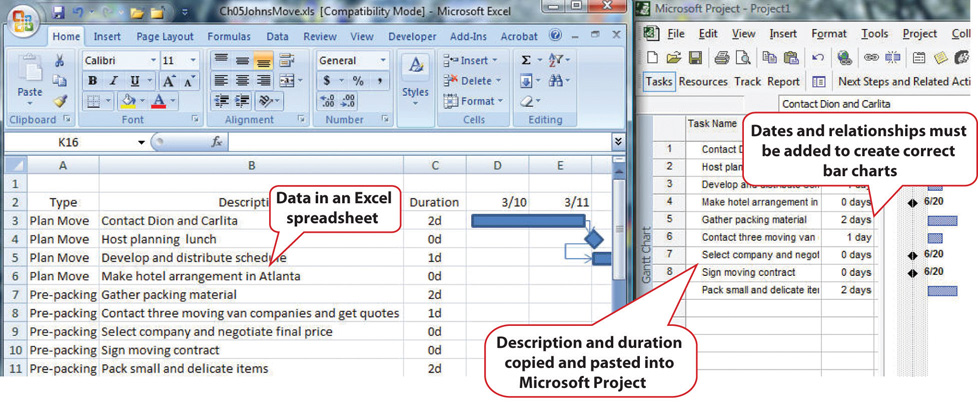
The relationships between project activities can become complicated in medium- and high-complexity projects. Dedicated project management software can compute the sum of activity durations along several different paths through complex relationships and recalculate them immediately if any of the durations or starting times are changed. Similarly, charts and reports are updated automatically based on the new data. The most popular software for medium-complexity projects is Microsoft Project. If a project manager begins work on the project in the belief that it can be managed using a list of activities in a word processing program or in a spreadsheet, the list of activities and their durations can be copied and pasted, or imported, into the project management software’s table of activities, if the original document or spreadsheet was designed with that possibility in mind, as shown in Figure 6.25 “List of Activities Transferred to a Project Management Program”.
Figure 6.25 List of Activities Transferred to a Project Management Program
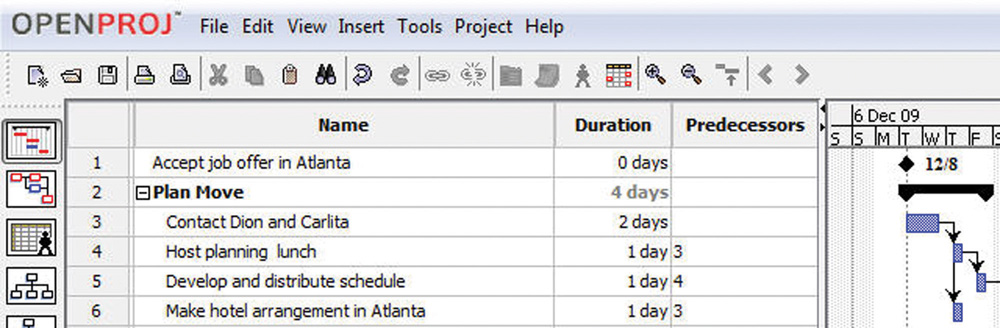
Once the data are placed in the project management software, the relationships can be defined and reports created. Organizations on a tight budget might consider using an open source program named OpenProject. Open source software is usually available at no cost for individual users and with fewer restrictions than proprietary software like Microsoft Project. OpenProject is similar to Microsoft Project, as shown in Figure 6.26 “Open Source Project Management Software”, and could be used on low- and medium-complexity projects that do not need the more advanced features available in Microsoft Project.
Figure 6.26 Open Source Project Management Software
Software for Complex Projects
Complex projects can involve thousands of individual activities and a company might have several projects going at the same time. Large, complex projects are common in the construction industry. A software that is commonly used for complex projects in construction is P3 or P6 from Primavera. It has the ability to produce sophisticated reports that help project managers to anticipate problems and make projections.
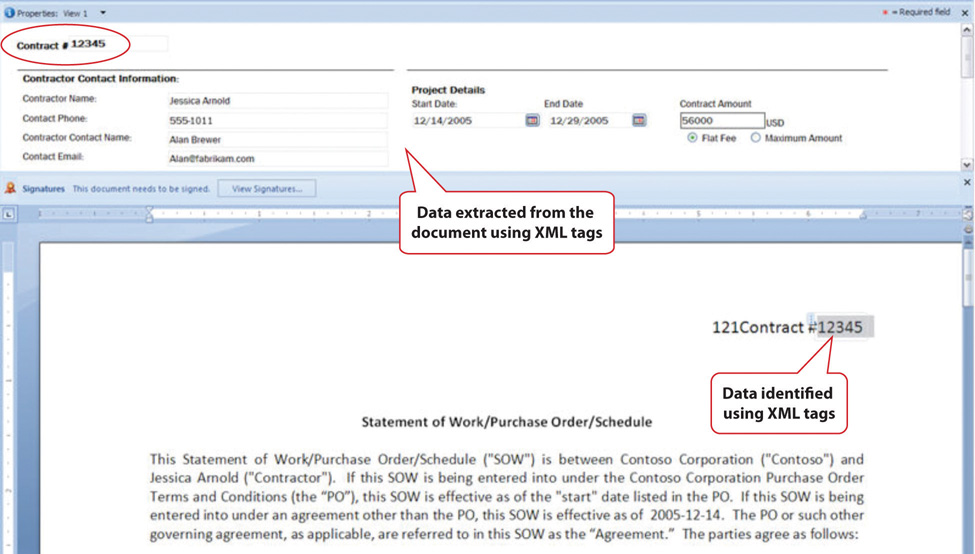
Word processing documents often contain data that could be aggregated and analyzed. Beginning with Microsoft Word 2007 and the .docx file format, it is possible to insert characters called tags on either side of a particular section of a form or document and assign a data label. For example, the name of the supplier on an invoice could be enclosed between two tags: <supplier>Thompson Hardware</supplier>. These tags resemble those used in the hypertext markup language (HTML) to identify how to display text on a Web page, but instead of telling a Web browser how to display the name of the supplier, it identifies Thompson Hardware as the supplier. These tags are can be created by following a set of rules called the extensible markup language (XML). Forms created using XML can be scanned for the content that is marked by tags. The data can be imported into a spreadsheet or database for analysis. Creating documents that use XML to identify data in the forms can be done using Microsoft InfoPath. An example that identifies key facts in a document that was prepared using InfoPath is shown in Figure 6.27 “InfoPath Form with XML Tags”. Because it takes extra effort to learn to use InfoPath, or a similar XML authoring program, and to create the forms, this approach is normally limited to complex and sophisticated organizations that have the need to manage large amounts of data.
Figure 6.27 InfoPath Form with XML Tags
Key Takeaways
- Low-complexity projects might be managed using general purpose word processing and spreadsheet software by using the special features for outlining, managing data, and inserting graphic objects
- Medium-complexity projects need special purpose software for managing project activities, such as Microsoft Project, and graphic software such as VISEO. Open source software such as OpenProject and Open Office Draw may suffice.
- High-complexity projects need more sophisticated project management software like P6 from Primavera. Forms can be created using XML tags that allow data to be extracted from the documents.
- Files can be stored at a location that is accessible by all the team members. They can be granted different levels of access, including view only, edit only, and ownership. Features like track changes and compare documents can help manage edits.
Exercises
- General purpose word processing and spreadsheet software might be sufficient for managing _____ (low-, medium-, high-) complexity projects.
- Three features that are available in spreadsheet programs such as Microsoft Excel to manage tables of data are subtotal, sort, and _________.
- If outline levels are assigned in a word processing document, the outline may be _________ or expanded to hide or display different levels of detail.
- ______-________ (two words) software is often available at no cost, and its use is less restricted than proprietary software.
- A VPN connection uses ___________ to protect the content of the communication.
- How are XML tags similar to HTML tags and how are they different?
- How should activity information be organized in a spreadsheet to make it easier to transfer to a project management program?
- What are three options for creating a diagram that displays a project’s reporting hierarchy for low- or medium-complexity projects?
- What is an example of a software product that is commonly used for highly complex projects?
- What are three levels of file access and editing permissions that can be assigned, and what are examples of user groups that would be assigned to each level?
Internalize your learning experience by preparing to discuss the following.
Describe an experience you might have had with editing the same word processing document and how you managed the revisions. If you used some of the features described above, how well did they work? What features were described that might have been helpful?
