13.3 Sales Metrics (Measures)
Learning Objectives
- Describe the sales cycle.
- Understand the selling metrics that salespeople use.
- Understand the selling metrics that sales managers and executives use.
The Sales Cycle
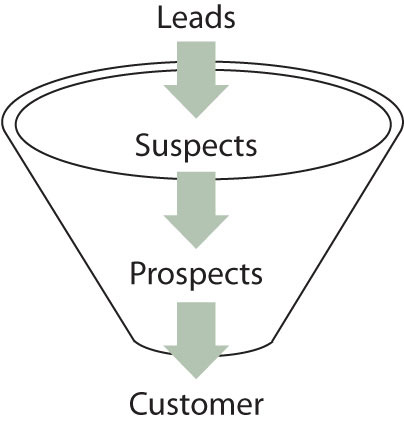
A key component in the effectiveness of salespeople is the sales cycle. The sales cycle—how long it takes to close a sale—can be measured in steps, in days, or in months. As Figure 13.9 “The Sales Cycle” shows, the sales cycle is depicted as a funnel because not all the people and firms a salesperson talks to will become buyers. In fact, most of them won’t.
Figure 13.9 The Sales Cycle
 suspects -> prospects -> customer)” style=”max-width: 497px;”/>
The sales cycle starts with leads, some of whom become suspects. Some suspects become prospects, and some prospects become customers.
The cycle starts with a lead, which is often nothing more than contact information of someone who might be interested in the salesperson’s product. To follow up on the lead, the salesperson might phone or drop by to see the person identified in the lead. This stage of the sales process is called the approach. (Recall that prior to the approach the salesperson may engage in preapproach planning and research.) During the approach, the salesperson introduces himself or herself and his or her company to the buyer. If the buyer shows interest, the salesperson then moves to the next step in the sales process.
A suspect is a person or organization that has an interest in an offering, but it is too early to tell what or if they are going to buy. They’ve agreed to meet with the salesperson and will possibly listen to the sales script or participate in a needs-identification process. During the needs-identification stage, the salesperson is trying to qualify the account as a prospect. Qualifying a prospect is a process of asking questions to determine whether the buyer is likely to become a customer. A prospect is someone with the budget, authority, need, and time (BANT) to make a purchase. In other words, the person has the money to make the purchase and the authority to do so; the person also needs the type of product the salesperson is selling and is going to buy such a product soon.
Once the purchase has been made, the sales cycle is complete. If the relationship between the company and the buyer is one that will be ongoing, the buyer is considered one of the salesperson’s “accounts.” Note that the buyer made a decision each step of the way in the cycle, thereby moving further down the funnel. She decided to consider what the salesperson was selling and became a suspect. She then decided to buy something and became a prospect. Lastly, she decided to buy the salesperson’s product and became a customer.
Metrics Used by Salespeople
As you know, the key metric, or measure, salespeople are evaluated on are the revenues they generate. Sometimes the average revenue generated per customer and the average revenue generated per sales call are measured to determine if a salesperson is pursuing customers that are the most lucrative. How many prospects and suspects a salesperson has in the pipeline are two other measures. The more potential buyers there are in the pipeline, the more revenue a salesperson is likely to generate.
Conversion ratios are an extremely important metric. Conversion ratios measure how good a salesperson is at moving customers from one stage in the selling cycle to the next. For example, how many leads did the salesperson convert to suspects? A 10:1 ratio means it took ten leads for the salesperson to get one suspect who agreed to move to the next step. A salesperson with a 5:1 ratio only needs to pursue five leads to get a suspect. So, if the representative can make only ten sales calls in a day, then the salesperson with the 5:1 ratio will have produced two suspects versus just one suspect for the other salesperson. As a result, the second rep will have more suspects in the pipeline at the end of the day. Similarly, how many suspects did the salesperson convert to prospects and finally to customers? If all the other conversion ratios (suspect-to-prospect ratio and prospect-to-customer ratio) are the same for the two salespeople, then the rep with the 5:1 ratio will close twice as many sales as the one with a 10:1 ratio.
Salespeople can track their conversion ratios to identify which stages of the sales cycle they need to work on. For example, the sales representative with 10:1 ratio can study what the rep with the 5:1 ratio is doing in order to try to improve his efficiency and sales levels. His conversion ratios also tell him how many sales calls he has to make each day or week to generate a sale and how many calls must be made on leads, suspects, and prospects to convert them.
How many sales calls of each type a representative has to make in a certain period of time are activity goals. As Figure 13.10 “How Activities and Conversions Drive Sales” illustrates, activities and conversions drive sales. More calls translate into more conversions, and more conversions translate into more sales. You can think of it as sort of a domino effect.
A win-loss analysis is an “after the battle” review of how well a salesperson performed given the opportunities she faced. Each sales opportunity after the customer has bought something (or decided to buy nothing) is examined to determine what went wrong and what went right. (Keep in mind that to some extent, all salespeople think back through their sales call to determine what they could have said or done differently and what they should say or do again in the future.) When several professionals are involved in the selling process, a win-loss analysis can be particularly effective because it helps the sales team work together more effectively in the future. Like a team watching a film after a football game, each member of the sales team can review the process for the purpose of improvement. When the results are fed to managers, the analysis can help a company develop better products. A marketing manager who listens carefully to what salespeople say during a win-loss analysis can develop better advertising and marketing campaigns. Communicating the same message to the entire market can help shorten the sales cycle for all a company’s sales representatives.
Figure 13.10 How Activities and Conversions Drive Sales
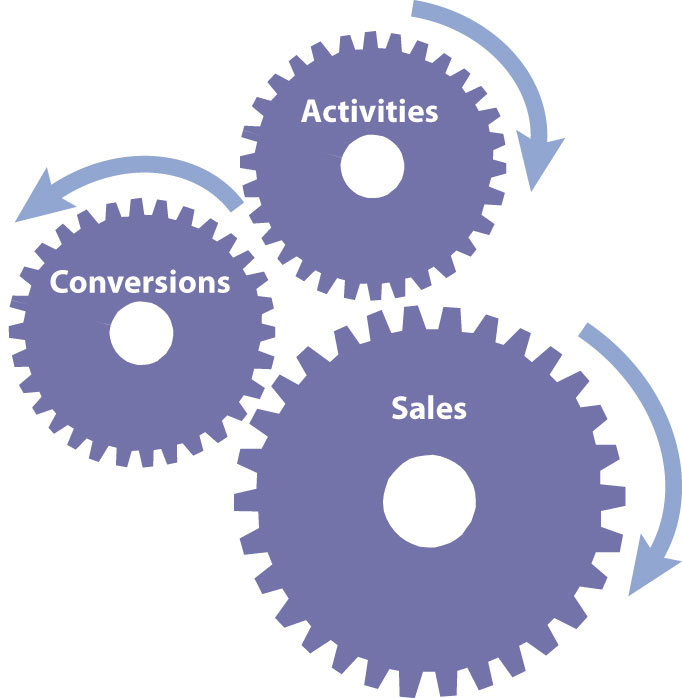
Activities, or sales calls of various types, drive conversions, which then drive sales.
Another important metric used by many salespeople is how much money they will make. Most salespeople are paid some form of incentive pay, such as a bonus or commission, which is determined by how much they sell. A bonus is paid at the end of a period of time based on the total amount sold, while a commission is typically thought of as a payment for each sale. A bonus plan can be based on how well the company, the individual salesperson, or the salesperson’s team does. Some salespeople are paid only on the basis of commission, but most are paid a salary plus a commission or a bonus.
Commissions are more common when sales cycles are short and selling strategies tend to be more transactional than relationship oriented. Perhaps one exception is financial services. Many financial services salespeople are paid a commission but expected to also build a long-lasting relationship with clients. Some salespeople are paid only salary. As might be expected, these salespeople sell very expensive products that have a very long sales cycle. If they were only paid on commission, they would starve before the sale was made. They may get a bonus to provide some incentive, or if they receive a commission, it may be a small part of their overall compensation.
Metrics Used by Sales Managers
The sales manager is interested in all the same metrics as the salesperson, plus others. The metrics we discussed earlier can be used by the sales manager to evaluate salespeople, promote them, or pinpoint areas in which they need more training. Sales managers also use sales cycle metrics to make broader decisions. Perhaps everyone needs training in a particular stage of the sales process, or perhaps the leads generated by marketing are not effective, and new marketing ideas are warranted. Sales cycle metrics at the aggregate level can be very useful for making effective managerial decisions.
Sales managers also look at other measures such as market share, or how much of the market is buying from the firm versus its competitors; sales by product or by customer type; and sales per salesperson. Sales by product or by product line, especially viewed over time, can provide the sales executive with insight into whether a product should be divested or needs more investment. If the sales for the product line are declining but the product’s market share is holding firm, then the entire market is shrinking. A shrinking market can mean the firm needs to look for new markets or develop new offerings.
Time is yet another element that sales managers look at. If the firm’s sales are declining, is the company in a seasonal slump it will come out of, or does the firm have a serious, ongoing problem? Sales executives are also constantly concerned about what the firm’s sales are doing relative to what was forecasted for them. Forecasts turn in to sales quotas, or minimum levels of sales performance for each salesperson. In addition, forecasts turn into orders for raw materials and component parts, inventory levels, and other expenditures of money. If the forecast is way off, then money is lost, either because the company ran out of products or because too much was spent to build up inventories that didn’t sell.
In Figure 13.11 “An Example of the Sales Data Sales Managers Utilize”, you can see a sample of data a sales manager may review. As you can see, most of the sales teams are performing near quota. But what about the Midwest? Selling 7 percent more is a good thing, but an astute manager would want to know why sales were short by over $200,000. Inventory can be balanced against the Southeast’s shortfall, but that adds cost to ship from the plant to Atlanta, then to Chicago. Accurate forecasts would have put that product in the Midwest’s Chicago warehouse to start with.
Figure 13.11 An Example of the Sales Data Sales Managers Utilize
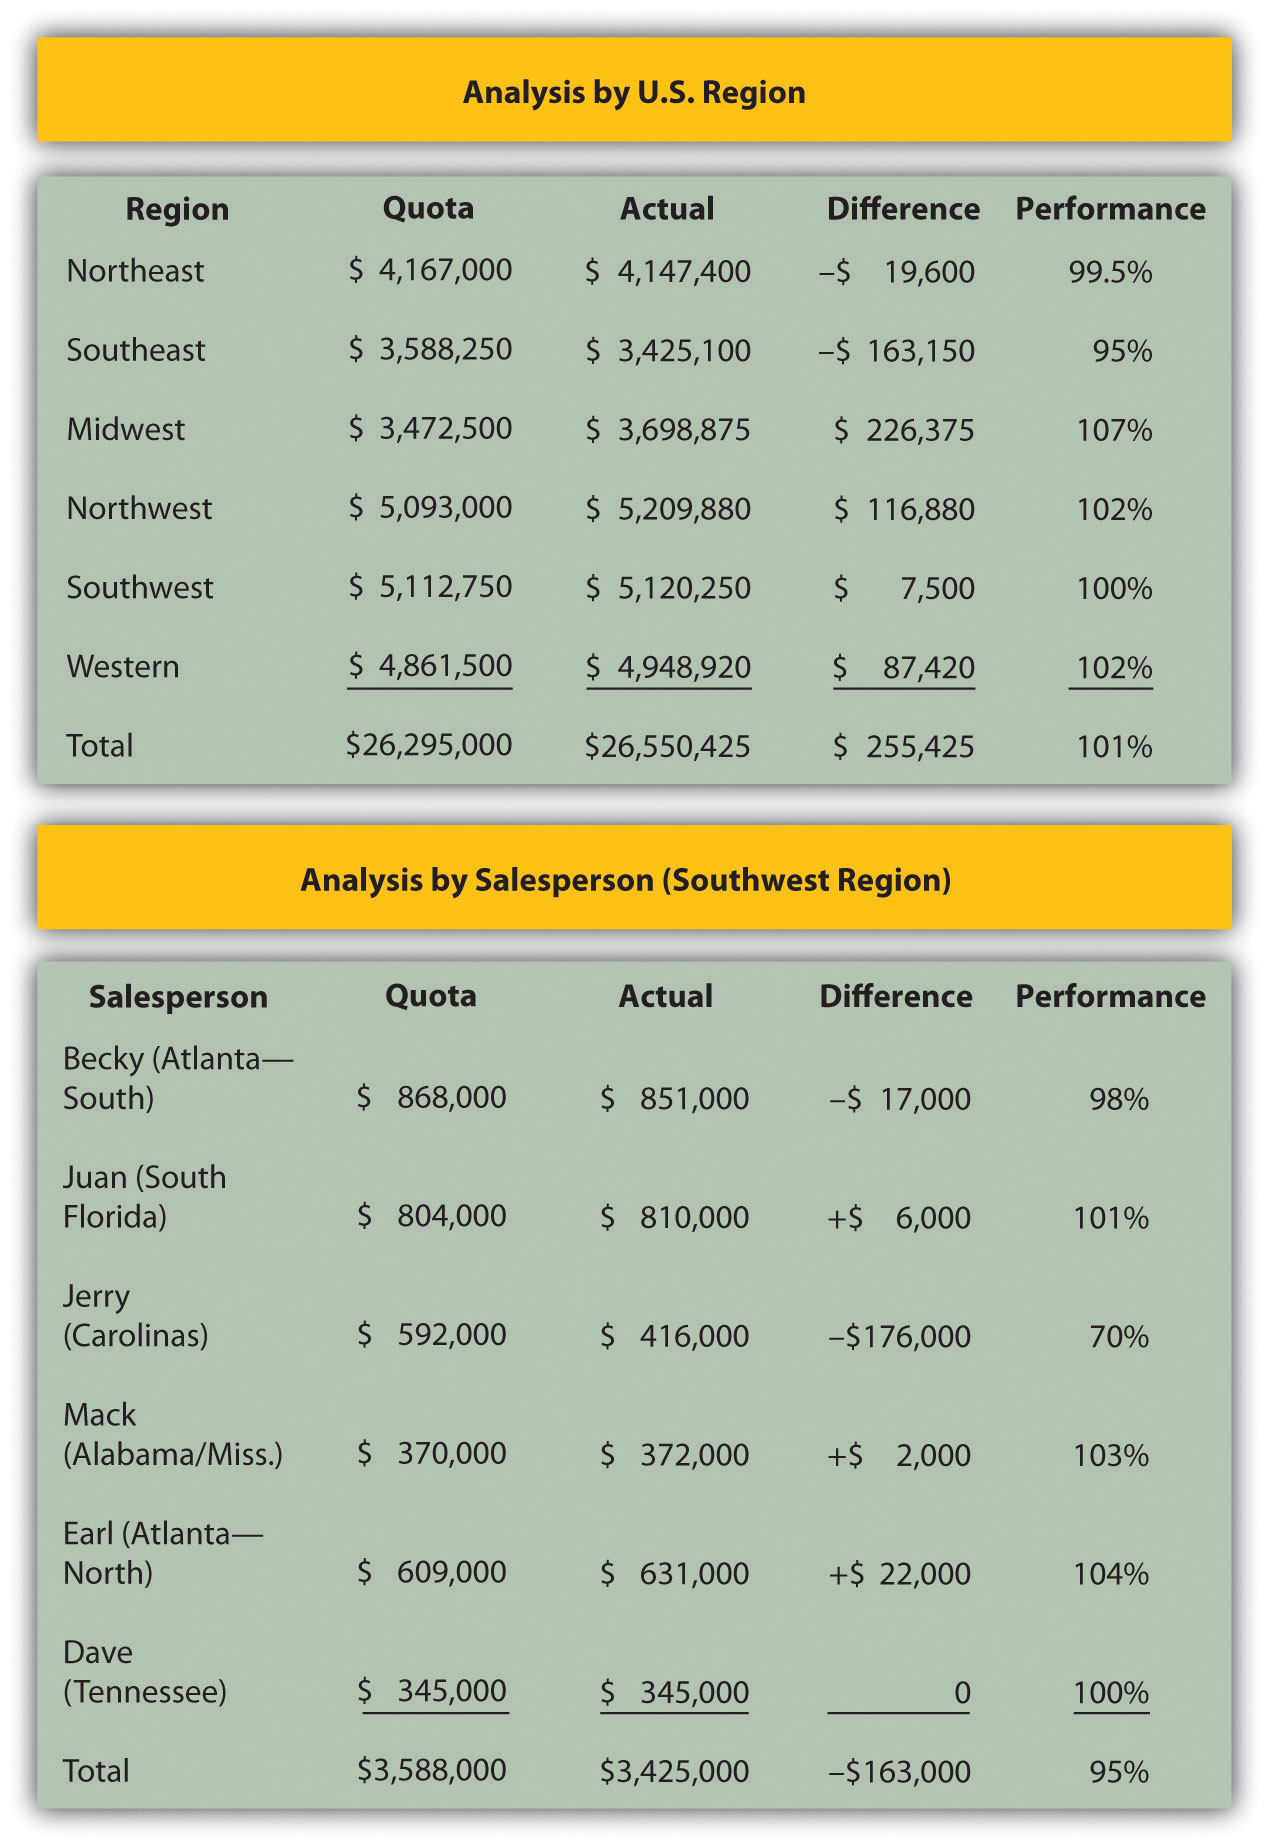
Tables such as this provide information that managers use to evaluate sales performance against expected sales, or quota.
Similarly, a manager would be concerned about Jerry’s lack of sales. That one salesperson accounts for the entire region’s shortfall against quota. Was the shortfall due to Jerry’s inability to sell, or did something happen in the territory? For example, if a hurricane came ashore in the Carolinas or if Jerry had a health problem arise, the manager’s concern would be different than if Jerry lost a major account or had a history of failing to reach quota.
Sales executives don’t just focus on sales, though. They also focus on costs. Why? Because many sales executives are held accountable not only for their firms’ sales levels but also for profit levels. Money has to be spent to sell products, of course: If the firm spends too little, the sales force will be unable to perform effectively. If the budget to attend trade shows is cut, for example, the quantity and quality of leads salespeople get could fall—and so could their sales. But if the firm spends too much on trade shows, the cost per lead generated increases with no real improvement in the sales force’s productivity. Perhaps the “additional” leads are duplicates or take too much time to follow up on.
Customer satisfaction is another important metric. Salespeople and their bosses want satisfied customers. Dissatisfied customers not only stop buying a company’s products, they often tell their friends and family members about their bad purchasing experiences. Sometimes they go so far as to write blogs or bad product reviews on Web sites such as Epinions.com. Some research studies have shown that average customer satisfaction scores are less important than the number of complaints a company gets. Perhaps it’s because of the negative word-of-mouth that unhappy customers generate.
In addition to tracking complaints, companies measure customer satisfaction levels through surveys. An average score of 3 on a scale of 1 to 5 could mean two things. The score could mean that everyone is, on average, happy and therefore gave the company a rating of 3.0. Or the score could mean that half of the customers are wildly enthusiastic and gave the company a 5 while the other half was bitterly disappointed and rated the company a 1. If the latter is the case, then half of the company’s customers are telling their friends about their negative experience and discouraging many others from buying. Sometimes companies hire firms like TeleSight, an organization capable of tracking satisfaction scores for an entire industry. Using a service like this, the sales executive can not only track the company’s customer satisfaction scores but also see how they compare with the scores of the industry overall.
Key Takeaway
The sales cycle is a basic unit of measurement indicating how long it takes to close a sale. Salespeople examine their performance at each stage of the sales cycle in order to identify specific areas for improvement. A salesperson who shortens the cycle is able to generate more revenue with the same amount of effort. Salespeople also track their conversion ratios to identify which stages of the sales cycle they need to work on.
Sales executives track the same metrics as individual salespeople but at the aggregate level. If many salespeople are struggling with one stage of the sales cycle, for example, then additional training or marketing may be needed, or a new strategy is necessary. Sales executives also look at their firm’s sales relative to their forecasts in order to spot possible trends. A firm’s sales trends affect many of the other decisions the company’s executives have to make, including manufacturing and output decisions. Sales managers also have to manage their company’s selling costs. Sales managers are often responsible for a firm’s sales and its profit levels.
Review Questions
- How might the sales cycle vary across the types of sales positions? How do salespeople use the sales cycle to manage their performance?
- What is the relationship between conversion ratios and activity goals? How do salespeople use this information? How do sales executives use the information?
- What metrics do sales executives use that salespeople are less concerned with?
