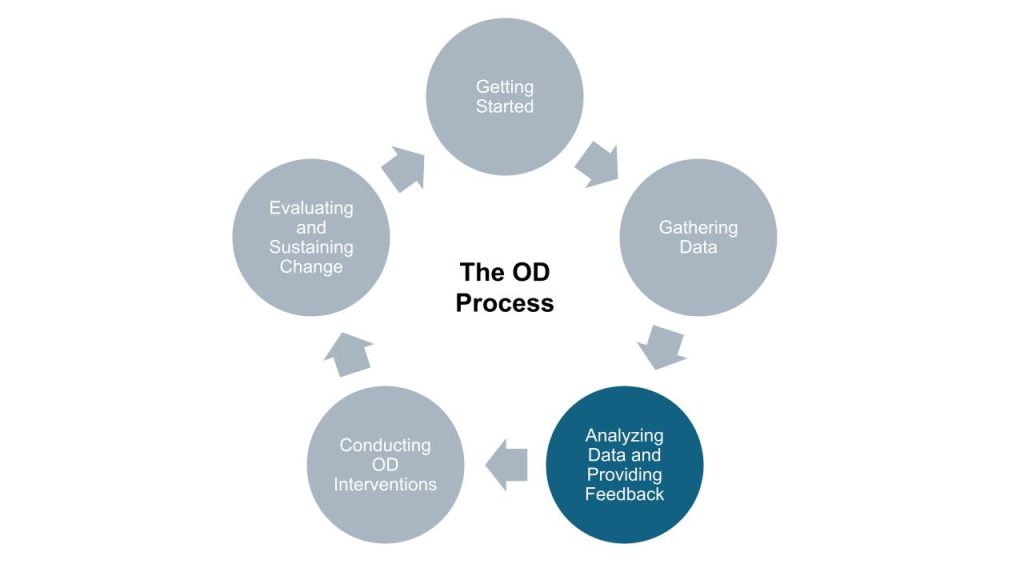
Chapter Six: Analyzing Data and Providing Feedback
Chapter Overview
This chapter discusses how to diagnose opportunities for change and improvement in organizational settings. We will learn some techniques to analyze data, aiming to build a broader understanding of the current situation, the leading causes contributing to it, and potential barriers and facilitators to promote change. The chapter emphasizes the importance of systemic thinking when conducting analysis and provides guidelines on summarizing findings into an actionable diagnosis. Lastly, it discusses practical ways to communicate the diagnosis to the organization, helping define priorities and next steps.
Contents
6.1 Purpose of Analyzing Data and Feedback Stage
6.2 Analyzing Data
6.3 Feedback – Communicating Diagnosis and Discussing Next Steps
6.4 Ethical Concerns in the Data Analysis and Feedback Stage
6.5 Tips for Developing OD Skills: System Thinking and Problem Identification
Questions for Reflection & Summary
6.1 Purpose of Analyzing Data and Feedback Stage
The diagnosis and feedback stage is a core stage in the OD process. This is when the change facilitator translates the data gathered and analyzed into meaningful and actionable insights for the organization. It is also when the organization has the opportunity to look at its situation and the problem they are trying to solve from a broader perspective and in a structured way. In this stage, the change facilitator and organizational members discuss the findings from the data collection stage and address potential next steps to tackle the identified issues and opportunities for change and improve organizational effectiveness. The final goal of the diagnosis and feedback stage is to have a solid understanding of the current situation, a shared vision of the desired future, and a plan of action to move forward with the OD process.
A good data analysis is critical to identify the “real problems” the organization needs to address to enhance effectiveness. Being able to communicate the findings in a structured and compelling manner helps organizational members expand their understanding of the organizational situation and prompts a conversation about potential solutions, priorities, and next steps. Importantly, the change facilitator must be open to questions and different perspectives from organizational members and be able to incorporate their contributions during the feedback process. An effective feedback conversation not only establishes a shared understanding of the need for change but also generates energy and commitment to action.
6.2 Analyzing Data
In Chapter 5, we discussed the different methods of collecting data in an organizational setting. Data collected can be both qualitative and quantitative, and there are different ways to analyze different types of data. Most of the time, in an OD process, the focus of data analysis is to identify patterns in the data and provide explanations for the situation(s) the organization is facing. When analyzing data in OD processes, we try to understand “what is going on” in the organization and look for the root causes of the issues impacting organizational effectiveness. Some key questions to consider when analyzing data in the OD process are, for example:
- What are the problems the data is showing?
- How do these problems impact the organization?
- What are the contributing sources of the problem?
- What are the underlying issues?
- What are the strengths this organization has that can help solve the problems or enhance effectiveness?
- What are the opportunities to improve?
- Are there inconsistencies in the data?
- What needs to be further investigated?
We can think about the data we collect as pieces of a large puzzle. The analytical work aims to put these pieces together to create a broader picture. However, unlike most puzzles, the data collected does not always fit perfectly into the picture. We may find inconsistencies, irrelevant information, and incomplete information. In the data analysis stage, we look for patterns in the data and develop hypotheses about how these patterns might explain the situation the organization is facing and the issues its leaders are trying to solve.
There are several different ways to analyze data, and individuals will develop their analytical skills with practice. Someone skilled in data analysis often combines a structured process with some creativity. A general process for those starting to practice data analysis could be:
- Organize the data collected – it is important to keep track of the information source (company report, interview, meeting minutes, observation, survey responses, and others) and the date it was collected. Also, if you interviewed organizational members and agreed you would not share identifiable information, make sure you anonymize information before sharing it.
- Familiarize yourself with the data – a good practice before starting to categorize data and look for patterns is to get as familiar as possible with the data you collected. Take a look at all the data, keeping the broad question “what is going on here?” in mind. Take general notes.
- After you are familiar with the data, you can choose a more structured approach to analyze the information further. You can use a deductive, an inductive approach, or both. These approaches will help you find patterns and explanations, but they will also point out inconsistencies and questions. In some situations, you may have the opportunity to elucidate these questions. In other cases, you might need to share them as part of your diagnosis and define the next steps to clarify these points.
- You have your diagnosis when you develop some hypotheses that may explain the organizational situation. Now, it is time to think about the best way to communicate what you found to other stakeholders in the organization. In section 6.3, we provide some suggestions on how to communicate your diagnosis effectively and have a feedback conversation.
6.2.1 Analysing data using a deductive approach – using models
Deductive approaches for data analysis use a predefined structure to organize the data collected. In organizational development, we usually use an organizational model or theory. For example, you can use the organizational model described in Chapter One, the 7-S, or the Star Model to sort your data into different organizational elements. After categorizing your data, you can look at the whole model and identify where are the main issues and potential opportunities for improvement, which characteristics in the different elements are contributing to the problem, how these elements are interrelated, whether they are well-aligned or whether misalignments are impacting the organization’s performance.
Deductive analysis using models can be helpful if you are starting to develop your analytical skills, as it offers an inquiry structure to follow. Following the model, you consider what your data say about each organizational element – What do we know about this organization’s vision? What about the strategy? Is there a clear strategy? Is it aligned with the vision and goals the organization aspires to achieve? And so on. The model structure helps you to think about all the main essential elements of that model. Another benefit of using a model is that it offers a structure to communicate your diagnosis to the organization in a language that is usually familiar to organizations (e.g., processes, strategy, skills). Nevertheless, the focus on the elements of one specific model may make you overlook other aspects of the situation that may not be as clearly connected with the adopted model.
6.2.2 Analysing data using an inductive approach – looking for common themes
In the inductive approach, we start from the data instead of using a predefined model. We search the data for repeating themes and seek to understand how these prevalent themes explain the organization’s situation, its challenges, and potential opportunities for development. For example, you may find that lack of collaboration across organizational departments is a main theme if you hear a lot of individuals mentioning how departments function in silos or how difficult it is to get someone from a different department to help with a project. You may get from the organization climate survey that collaboration scores very low. This approach to analyzing data is sometimes called thematic analysis. Some people will use color coding to identify common themes (Figure 1), while others may work with sticky notes (Figure 2) or use a table or a spreadsheet. The outcome of this analysis is a list of predominant themes that explain the organizational situation and shed light on opportunities for improvement.
Attribution-NonCommercial-NoDerivs (CC BY-NC-ND 2.0)


Because it is a less structured approach, it may be more challenging for those with less practice in data analysis. There are no specific guidelines on how to find the key themes, and it requires a lot of interaction with the data and multiple attempts to categorize data in different ways until you have a compelling picture of the situation. Therefore, inductive analysis often requires a significant time investment. Nevertheless, this less structured approach might allow for deeper analysis and identifying important elements that would not be spotted using a pre-defined model. Another benefit of inductive approaches is that you can use language that is familiar to the organization. For example, instead of pointing out the potential opportunities in the organization’s strategy, you can talk about opportunities in their “5-year growth plan,” if that is what they call their strategic plan.
6.2.3 Developing a robust analysis
There are advantages and disadvantages of using deductive or inductive data analysis. Therefore, no matter what approach you choose to analyze organizational data, it is always important to be aware of potential traps and ways to ensure robust data collection.
One of the most common traps in data analysis is related to the biases of the individual conducting the analysis. It is just natural that, as human beings, we will look at the data with our unique lenses. Our knowledge, previous experiences, and values will influence these lenses and make us focus more on certain aspects than others. If you are very process-oriented, you might emphasize issues with processes and overlook problematic interpersonal relationships, or vice versa. Donald Schon and Chris Argyris developed the concept of the ladder of inference to explain this phenomenon.
Some recommendations to make your analysis robust:
- Organize your data – whether you are sorting your data into predefined categories of a model or looking for common themes, it is critical to keep it organized. Spreadsheets, sticky notes, and color all help categorize your data. Make sure you have an easy system to identify the source of each piece of information. You can add codes to identify your source – “I” for interviews (e.g., I1, I2, I3), “R” for reports, “N” for news, for example.
- Look at your data in different ways – sorting your data in multiple ways can help you identify hidden patterns. For example, you can categorize your data using a model and then experiment with thematic analysis to see what additional learnings emerge, or vice versa.
- Gather data from multiple sources – collecting data from multiple sources allows you to triangulate this data and look for consistencies and inconsistencies. This is not only important to provide a complete picture of the situation, but also helps reduce the risk of biases.
- Include others’ perspectives – including others’ perspectives is also an excellent way to minimize analytical biases. This can be someone working with you to facilitate change who also helped with data collection. You can ask some key stakeholders to look at your preliminary analysis and provide their input.
- Investigate inconsistencies – you will likely find some inconsistencies in your data, and it is crucial to investigate them further. This might be due to different groups having a distinct interpretation of a situation, which may be an important insight to help understand the whole picture.
6.3 Feedback – Communicating Diagnosis and Discussing Next Steps
One critical aspect to consider is whether you are an external OD practitioner helping an organization to promote change and improve its performance, or an internal member of the organization working on a change project; you should consider your diagnosis as a preliminary result of your analysis. This is because in OD work, the final diagnosis is developed when feedback is provided to the organization and inputs from others are incorporated. For this reason, feedback is an essential stage of the OD process.
Providing feedback about the diagnosis to the organization is crucial to the success of the change effort for three main reasons. First, it is an opportunity to validate your analysis and get additional input that might explain some inconsistencies or shed light on points that are still unknown. This discussion helps the organizational members expand their understanding of the situation and identify the main opportunities for change and improvement. Second, the feedback helps organizational stakeholders to prioritize the most urgent and important issues that should be tackled. Third, it creates alignment among the various stakeholders in the organization on what needs to be done and why that is important, generating accountability for the change and energy for action.
Usually, the feedback happens in a meeting with the organization’s key stakeholders. Good preparation for the feedback meeting is imperative and should include a presentation of the main diagnosis findings and a space for dialogue about these findings. When preparing for the feedback meeting, a change facilitator should consider the following:
- Which stakeholders should be invited to participate in this discussion?
- In general, the discussion should involve all stakeholders who are highly interested in the change process and have the power to make decisions and support or obstruct the change.
- What information should be presented?
- Change facilitators often receive a large amount of information from their analysis, and it is important to select the most useful and relevant information to share. Returning to the original problem they are trying to solve is a good strategy for selecting the information that will expand their understanding of that situation. More detailed information can always be shared as necessary.
- What would be the best format to present the results?
- The best format will depend on the situation and style of the organization and its stakeholders. Change facilitators frequently present their findings using slide presentations. Sometimes, a report is sent in advance of the feedback meeting. No matter which format you choose, the information should be well-structured and clearly presented. It is also important to have data (non-identifiable if it is data from interviews) supporting the statements in your diagnosis.
More than presenting the diagnosis, the change facilitator must be prepared to facilitate a productive and future-oriented discussion, generating alignment among the various stakeholders, avoiding focus on “who is to blame,” and directing the energy to discuss potential next steps that will lead to a solution.
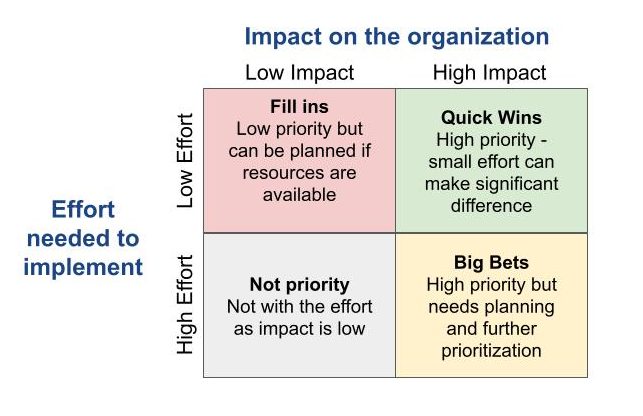
In general, a well-conducted diagnosis will identify a handful of opportunities for improvement. In a feedback meeting, it can feel overwhelming and be difficult for stakeholders to decide what to do next. The change facilitator is vital in helping the organization make decisions about priorities and next steps; otherwise, the change process may halt. Using a prioritization technique can help facilitate a discussion about where to get started or which opportunities for improvement should be prioritized. One valuable strategy is the impact-effort matrix (Figure 3). This matrix helps to categorize opportunities for improvement according to their potential impact on the organization’s performance and the required effort to address that opportunity, including skills, time, and financial and human resources.
6.4 Ethical Concerns in the Data Analysis and Feedback Stage
Individuals facilitating change from an OD perspective should be attentive to two ethical concerns that may present in this stage of the OD process. The first is to be careful with your own biases when presenting the findings of your diagnosis. Maintaining a critical perspective, asking yourself what other possibilities could explain your findings, having others contribute to the analysis, sharing your conclusions as preliminary findings, and inviting other stakeholders to question and add inputs are all good ways to minimize the risk of a biased conclusion.
The second aspect is the temptation to soften the message to the organization or, sometimes, be persuaded by some stakeholders to soften the message or retain information to avoid a difficult conversation or confrontation. Organizations often experience messy situations, have a toxic culture, or have toxic leadership, which can be hard to share. Nevertheless, honest feedback is necessary to create awareness and accountability for improvement. In these situations, it is essential to be respectful, to share the feedback only as one perspective and not the complete picture, and to invite stakeholders to share their perceptions. It is essential to consider that the organization has the right to access the information you collected as part of this process, ensuring anonymity when previously agreed. Additionally, it is helpful to remember and verbalize to all stakeholders that the goal is to look for opportunities for improving organizational performance versus looking for people to blame. Lastly, sharing the diagnosis in small groups or individually can be a good initial step in some situations since it gives individuals time to process and react before presenting it to a larger group.
6.5 Tips for Developing OD Skills: Systems Thinking and Problem Identification
Most OD skills are essential in the diagnosis and feedback stage. For example, systems thinking and openness to different perspectives are critical skills for conducting effective analysis. Similarly, communication, active listening, and the ability to ask insightful questions are vital in a feedback meeting. This chapter focuses on systems thinking and problem identification as key competencies for supporting organizations during this stage.
Systems thinking is the ability to view a problem from multiple perspectives and to identify interconnections and interdependencies. This requires understanding the components that constitute a system and how they interact to make the system function. When considering ways to support organizations in changing and improving their performance, systems thinking enables you to:
- See interrelationships between the many different components in an organizational system.
- Understand the potential impact of external factors on the organization and the change effort.
- Go beyond surface-level symptoms and identify potential root causes contributing to these symptoms and other organizational challenges.
- Understand how changes in one organizational component may affect other components in the system.
- Identify the different ways in which the system shapes individuals’ behaviors in the organization.
Some ways you can develop systems thinking skills:
- Look at the same situation from different perspectives. Ask yourself:
- What is another way to see this situation?
- What else might be going on here?
- What might I be missing or not seeing?
- Ask the perspective of others and listen attentively. Then, ask yourself:
- What does this person see that is different from how I see it?
- What data is informing their perspective?
- Draw!
- Sketch your understanding of the situation.
- Draw the different components involved in the situation and draw connections and relationships between them.
- Exercise your curiosity by trying new things and ways of doing things.
Problem identification is the ability to recognize a problem and identify the systemic factors contributing to it. It is the first step in solving a problem, but it is often not given the necessary attention. Many individuals and organizational leaders frequently jump into finding solutions without adequately understanding the real problem and its underlying causes. This lack of attention to problem identification often leads to inefficient solutions.
Some ways you can develop problem identification competency:
- Investigate different sources of information.
- Look for different perspectives – ask yourself and others about other possible explanations for the problem.
- Use the “5 Whys” technique – repeatedly ask the question “Why” to move beyond symptoms and uncover the root causes of a problem.
Questions for Reflection
- Analyzing data to identify problems and their underlying causes requires practice. It is an important skill for any professional. What activities could you seek out in order to help develop your analytical skills?
- Thinking about your personal characteristics and preferences, which factors do you need to be attentive to in order to reduce biases when analyzing organizational issues?
- Good preparation is key for a good feedback discussion. How would you prepare yourself to provide feedback to organizational members about your findings from the diagnostic stage?
- What can you do to reduce ethical problems in the diagnosis and feedback stage?
Summary
In the data analysis and feedback stage, we identify the root causes of organizational problems and articulate them to the organization. After gathering data, the change facilitators apply data analysis strategies to develop a broader understanding of the context, issues, and opportunities for improvement. In general, deductive and inductive analysis, or a combination of both techniques, are conducted by change facilitators. Importantly, the outcomes of the diagnosis stage should be seen as a preliminary perspective that needs to be communicated and discussed with the organization’s key stakeholders. Therefore, the feedback meeting, when the change facilitator shares the diagnosis and facilitates a conversation about it, is when the issues impacting the organization’s performance are discussed and articulated, and a potential action plan and next steps are defined. The ability to identify problems and their underlying causes, as well as attention to minimizing biases in the analysis and communicating clear, complete, and respectful feedback, are critical in this stage.
Media Attributions
- Step 3 of the OD Process – Analyzing Data and Providing Feedback
- image2
