Chapter 2: How Communication is Studied
2.4 Quantitative Approaches
Quantitative methods are based on the fundamental principle that good research must be objective, and they rely on procedures borrowed from the physical sciences, such as chemistry, engineering, and physics. If you want to discover the boiling point of water, for example, you don’t want to gather opinions and perceptions: you want to discover facts that can be represented in numbers. Imagine two scientists tackling that question, and one says “In my opinion, the boiling point of water is 108 degrees Celsius” and the other responds, “That doesn’t seem right to me; it feels like it’s 94 degrees Celsius instead.” That’s not good science. Another way to look at it is to spell out what doesn’t count as a source of scientific knowledge. Michael Beatty (1996) listed six unscientific sources of knowledge[1]:
Intuition: “I just know in my gut”
Tenacity and tradition: “We’ve always known that to be true”
Common sense: “C’mon, get real: everybody knows that….”
Personal experience: “Well, it happened to me, so I assume it’s universal”
Authority: “My doctor said it’s true”
Rationalism and deduction: “Logically speaking, it has to be true.”
This is a rather intimidating list, and it may include most of the ways you reach conclusions in your daily life. But science has often shown that what we “know” to be true isn’t true, and putting aside what we “know” and looking only at what the numbers actually show has led to many surprises and scientific advancements. In the field of communication and deception, for example, people have long believed that not being able to maintain eye contact is a give-away that someone is lying. When scholars started doing rigorous research on deception, however, they found this wasn’t true at all. [See Box 12.9, in the chapter on Nonverbal Communication]. To be a good scientist, it is important to put aside preconceived notions and be open to finding out that you are wrong about things you thought you knew. Biologist Martin Schwartz put it more bluntly in an essay titled “The Importance of Stupidity In Scientific Research”:[2] “The more comfortable we become with being stupid, the deeper we will wade into the unknown and the more likely we are to make big discoveries.”
You may be thinking, “Well, I can just observe communication and learn from what I see.” You’re in a classroom group already, so you can just watch what happens in that group. Several problems, however, immediately arise with this approach. One is the problem of selective perception: only noticing some examples and overlooking others. It’s hard to see everything that is going on, and give all examples equal weight. In your group, for example, you think there is equal participation because you can think of a time when each of the eight members spoke, and when Shonda pipes up and says something, it’s always funny and memorable. What you didn’t notice is that she only does that two or three times per meeting, while Peter talks far more often, but his comments are generally more mundane and not funny, and his voice is quieter. In other words, to conduct good research you can’t wait until a meeting is over and then rely on your impression of who spoke up how often. If you want an accurate picture, you’re going to have to count things: how many times each member made a contribution, and perhaps how long their statements were.
Another reason humans aren’t perfect at observation is because they tend to overreact to vivid examples. If you ask people “Which animal has killed the most humans?,” they may guess sharks because shark attacks get so much attention. People rarely guess the correct answer — mosquitoes — because the image of a mosquito bite is not as vivid. Likewise, more people are afraid of elevators than stairs, because they can picture what it would be like to be caught in a plunging elevator, while stairs are so ordinary (far more people, however, are injured on stairs than in elevators). This vividness effect can give us a distorted view of reality. In your classroom group, Kyle once shot down a suggestion of Pauline’s in a very harsh way, and another time got so frustrated with Will that he shouted in his face and stormed out of the room. High-drama moments like those can be extremely vivid, which might leave you with the impression that yours is a high-conflict group and Kyle is deeply unhappy in it. What you didn’t notice, however, is that during the group’s 11 meetings, those were the only two times Kyle got upset, and that most of the time his comments are civil and positive.
A third problem is confirmation bias: the tendency to seek out information that confirms that you’re right, and avoid sources that show you’re wrong. If you are convinced that Rachel is the most influential person in the group and shows leadership potential, you’ll be on the lookout for proof that you are right. Confirmation bias is a very strong human tendency, so it should come as no surprise that scholars and scientists can fall prey to it just like everyone else.
Selective perception, vividness effect, and confirmation bias are each understandable human tendencies, which illustrates that in order to be a good scientist, you need to fight human nature. This is where we turn to the scientific method. Scientists learn to conduct research by formulating hypotheses, devising ways to measure variables, eliminating extraneous variables as much as possible, setting up experimental and control groups, altering variables for the experimental group and measuring the effects, and comparing the two groups. Using some version of this process has helped scientists make extraordinary progress in many fields.
Let’s see how you could use this process to study the effects of group size on participation. The first method you could employ is experimentation.
Experiments. When designing an experiment, you need to create clear and measurable definitions. In this case, you’ll need an operational definition of “participation,” which you might define as “speaking aloud for at least ten seconds.” You could then set up groups of varying sizes: five participants, 10, 18. If you have the resources, record as many group discussions as you can, and create a spreadsheet to tally who spoke when and for how long. This painstaking cataloging would take a long time, so you could take a reasonable shortcut by relying on “random sampling”: take a recording of a group meeting, fast forward to a random spot, jot down who is speaking at that moment, and repeat the process a few dozen times; you’ll have a representative picture of participation without having to listen to the entire meeting.
Some challenges arise, however. The problem of controlling for extraneous variables is always an issue when it comes to experiments. For example, what topic is the group talking about? If they’re discussing something that all group members have opinions about, that’s entirely different from a group that gets on the topic of obscure anime movies, where only two members have anything to say. Do the group members know each other, or is this their first meeting?
The need to control variables illustrates why studying communication is so different from studying physics: communication is an inherently complex and multi-faceted process, and there is a potentially huge number of variables to consider. And the more you try to control for those extraneous variables, the more artificial the research becomes. If the topic of conversation is a variable, for example, the experimenter might have to dictate what the group talks about, and most normal group discussion isn’t restricted to only one topic. To control for members knowing each other, you might decide to use “zero history” groups where everyone is a stranger to each other — which is rare in real-life groups. The cleaner the experiment, the further it is from studying real people in a natural environment.
You could sort communication experiments along a continuum of highly controlled on one end and naturalistic on the other.
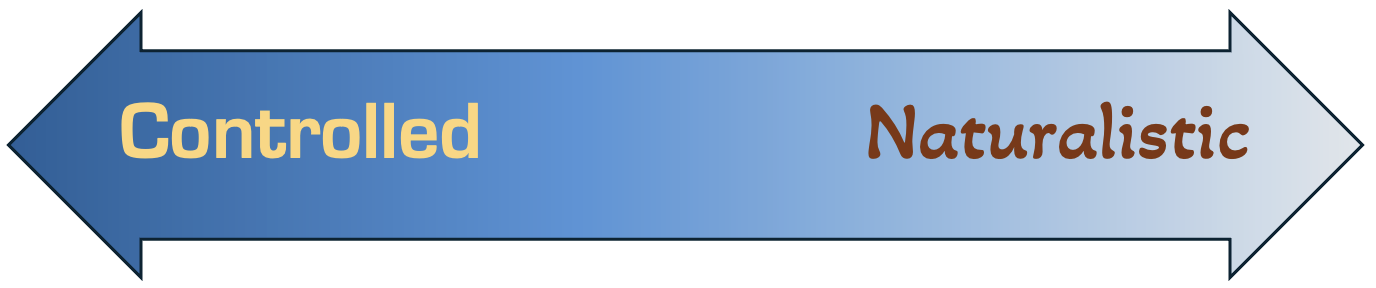
The continuum illustrates the tradeoffs you must make in experiments: the more controlled the experiment, the less natural it is, and vice versa. If you want to conduct a rigorous experiment on the influence of gender on persuasiveness, for instance, you could have speakers of different genders give speeches and have the audience rate their persuasiveness on a 10-point scale, but first you would have to control for variables such as age, height, ethnicity, attractiveness, voice quality, gestures, speech topic, speaker order (does the one who goes first have an advantage over other speakers?), and probably two dozen other variables you haven’t thought of yet. In the name of controlling variables, it’s probably better to use a recorded video message that you can digitally alter rather than a live speaker. In the low-tech era, researchers might have handed audiences a written script and a photograph and told them “Imagine this speech being delivered by that person.” This is what Albert Mehrabian did in a 1967 experiment on the relative influence of verbal vs. nonverbal channels, described in Box 12.2. His results — that only 7% of meaning is conveyed through words — are still widely cited, but most people who quote that statistic don’t realize that it’s based on a highly artificial experiment that did not involve live people actually speaking to each other.
An alternative is to incorporate more variables into the research instead of trying to eliminate them. The issue here, as any statistician can tell you, is that the more variables you incorporate, the weaker the patterns tend to be. In the 1980s, for example, many books addressed the effects of birth order on a child’s personality and relationships. Those books usually divided children into one of three categories: oldest child, middle child, and youngest child. More recent scholars, however, recognized many more variables that need to be taken into account:
- How large is the family? (In a family with 12 children, are children 2–11 all the same?)
- How long are the gaps between children? (If a child is born 15 years after their next oldest sibling, are they essentially an oldest child?)
- What about stepfamilies? (A child who is a member of two stepfamilies simultaneously can be an oldest child in one and a middle child in the other)
- What about twins and triplets?
- What about disability? (If the oldest has a severe disability, does a middle child function as the oldest?)
- What if a child dies?
- What is the role of gender, ethnicity, and culture? (If birth order patterns are universal, they should function the same in Nigeria, Saudi Arabia, and Paraguay.)
Once those factors were taken into account, the strong patterns asserted in the 1980s started to fade, leading the National Academy of Sciences to report in 2015 that “the search for birth-order effects on personality has not yet resulted in conclusive findings.”[3]
A final challenge when it comes to conducting communication experiments is permission. Some of the most famous early psychology experiments were psychologically damaging to their research subjects. Recognition of this damage led to the creation of the Institutional Review Board (IRB), charged with regulating experiments on human subjects. The IRB is, thankfully, very protective of the dignity and mental health of anyone who participates in an experiment, and has strict guidelines that must be met. I point this out because I want to make sure readers of this book know that you can’t do secret experiments on people without IRB permission!
Surveys. Another common way to gather quantitative data about communication-related topics is to conduct surveys. If you want to find out about participation in groups, why not just ask people if participation is equal in the groups they belong to? Note, however, that what you’ll get through this approach is a measure of perception, not reality, which is true for most surveys related to communication. Still, surveys are common in subdisciplines like organizational communication, where researchers want to learn how employees respond to different leadership styles or what makes remote workers feel a sense of identification with their company, or mass communication, where researchers want measures of how audiences respond to health awareness campaigns or advertising slogans. There are many polling companies that gather vital data on products, political issues, and social problems. Even if you don’t hire or work for such a company, if you have a college degree related to communication, odds are that sooner or later someone will ask you to “throw together a consumer survey for us, will you?” Technologically, it is easier to construct surveys, administer them, and analyze the data than it has ever been. The thing to keep in mind, though, is that it is easy to do a “bad” survey, and the people you present your data to may never realize its flaws. Doing a survey well, on the other hand, is hard work, and you should be aware of the basic requirements.
Much of the effort should go into crafting good survey questions — questions that are not biased or leading, make sense to respondents, and are easy to answer (or, stated in the negative, hard to misinterpret). When I was an undergraduate, I was in a project group that designed a survey, and I was shocked when our teacher handed it back saying “It’s too biased.” We tried to figure out ways that it could be biased, and turned it in again. “Still too biased.” None of us in the group could see the problem, but that doesn’t mean it wasn’t there. It took about five versions before the teacher accepted it— but luckily we had a teacher who was on the lookout for bias, or we would have just administered the survey and gathered results that looked legitimate.
Another basic issue to consider is whether to use closed- or open-ended questions. Closed-ended questions ask the respondent to choose from a set of predetermined responses, which can be as simple as “yes” or “no,” or can involve many possible answers (in a question about jobs, for example, you might have respondents pick from a list of categories, such as professionals, laborers, craft workers, etc.). These questions have the advantage of being easy to process; you can generate charts instantaneously. It’s more difficult, however, to figure out what the answers mean, and if the respondent answered them correctly. If you’re using a 5-point Likert scale to measure how satisfied people were with their latest doctor visit, an inattentive respondent might not notice that the scale is not what they are used to (1 = very satisfied), and click 5 (“very unsatisfied”) even though they were happy with the visit. For decades, pollsters have been asking voters “Are you satisfied or dissatisfied with the way things are going in this country?” If they are dissatisfied, does that mean they think the country is getting too conservative, too liberal, or something else entirely?
The best way to find out what people are really thinking is to use open-ended questions, which require the respondent to write something. These questions give the researcher more insight than closed-ended questions, but also create an extra job: what do you do with those responses? Summarizing or coding them takes a lot more time and thought than automatically generating a chart.
An additional challenge with surveys is where to find respondents: who takes the survey? Most of the time you want a representative sample — a set of people who reflect the views of the broader population (it doesn’t have to be the whole country: it can be employees in a specific company, users of a product or service, or a demographic group such as “Millennials”). No matter the size of the sample or broader population, the issues are the same: who will fill out the survey and who won’t, and how do they find out about it? These factors can be strongly affected by simple questions such as: (1) Did you (the researcher) select the respondents, or did they choose themselves? If they chose themselves, do they have motives you don’t know about? (2) What format will you use? Telephone survey, internet survey? If it’s the latter, what website will it appear on? Because of the self-selection issue, political polling about which candidate is ahead in a race is still largely done via telephone, which makes pollsters worry that whole categories of people aren’t represented because they won’t answer the phone. (For more, see Chapter 5 on Audience Analysis).
These challenges are serious enough that, even if you could do it on your own for cheap, it may be worth hiring a polling company to design and conduct the survey for you. If it was your boss who asked you to do it, the hard part may be convincing her to do it the expensive way.
Interaction Coding. Some scholars don’t want to rely on perceptions; they are interested in what people actually say in different contexts, which can be recorded and coded (after acquiring IRB approval, of course). Much of our understanding of group decision-making (Chapter 16), for instance, is based on putting people in groups, having them work out a problem, then sorting the statements of group members into categories and looking for patterns. First, researchers develop a limited set of categories into which they classify every utterance, then they train a group of coders how to sort the infinite variety of things people could say into those categories. In early decision-making research, for example, Robert Bales devised a 12-category coding scheme with items like “Asks for suggestion” and “Shows antagonism” and “Agrees.” While this approach provides a way to gather objective data on actual conversation, it’s labor-intensive, and coming up with coding categories takes a long time.
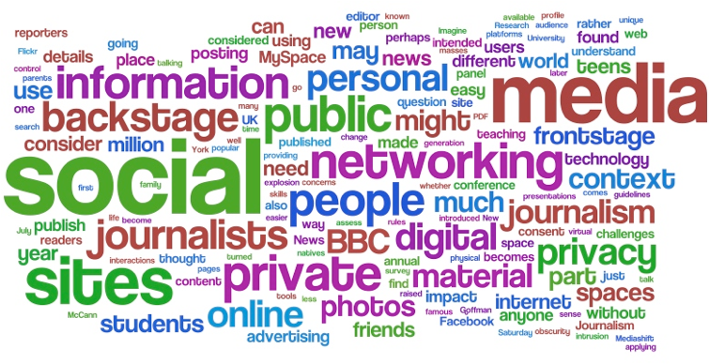
Content Analysis. People who study written communication — examining what companies put in their mission statements or how celebrities apologize for scandals — have the advantage of being able to look at real communication without many of the concerns listed above. This research can be done quantitatively or qualitatively, depending on what techniques you use to analyze the words. You may have seen examples of “word clouds,” which are just a visual way to represent the frequency of words in written texts.
The Limits of Quantitative Research
As mentioned, the basic assumption of every quantitative research technique is that objectivity is possible, and that success in using these techniques in the “hard sciences” can be matched in the social sciences. Not all scholars agreed, however, and some began to worry that the efforts to mimic the physical sciences was just window dressing. If you are very concerned about controlling extraneous variables and you design a highly artificial experiment, how do you know that the results will apply to real-life communication situations? If your research leads to specific findings about a particular variable, how well does it combine with other research on related variables? (You’ve probably noticed this with research on nutrition: one study shows that eating a particular food is good for your pancreas, another shows that it increases your risk of brain cancer, and a third shows that it helps your digestive tract but aggravates your joints, leaving you to wonder, “Am I supposed to eat that food or not?”). What researchers often want is answers to the question, “How does it all fit together?,” and isolated studies don’t get you there.
Then there is the issue of awareness. In a chemistry experiment, you don’t need to worry that the chemicals will change their behavior so they look good to the researcher. In human communication, however, that is always a concern. The IRB frowns on secret recording, so researchers often have to trust that subjects will act naturally in a lab setting and forget about the cameras.
Chemists also don’t have to worry about a chemical acting one way on one day and another way the next day; chemicals don’t have free choice. Science works best when it is looking at deterministic situations: Factor A predictably determines Outcome B. It has a harder time with “Well, it depends on what mood a person is in,” which is often a variable in communication. Some social scientists take the view that there is no such thing as free will, but because that goes against most people’s experience and belief systems, it’s not an easy argument to win. As Em Griffin put it, “Human choice is problematic for the behavioral scientist because as individual freedom goes up, predictability of behavior goes down.”[4]
It is because of these concerns that some researchers gravitate toward qualitative methods instead of quantitative ones. They believe that you miss a lot if you only focus on measurable variables, and they prefer to look at the communication process holistically. Instead of thinking of free choice as a research problem, they look at it as a topic worth studying, so they often focus on why a communicator chooses to make the choices they do (which is why qualitative research is often called “interpretive”). They are interested in looking at natural phenomena in context, which often means a greater willingness to embrace the messiness of life. They also think it is more honest to admit that the researcher is a human being, who attempts to be objective and unbiased but, knowing these efforts will never be completely successful, owns up to the problem. Sometimes this means that the researcher acts as a participant in the conversation instead of as an observer behind a two-way mirror.
- Beatty, M.J. (1996). Thinking Quantitatively. In An Integrated Approach to Communication Theory and Research, Ed. by Salwen, M.B. & Stacks, D.W. Mahwah, NJ: Lawrence Erlbaum Associates. ↵
- Schwartz, M.A. (2008). The Importance of Stupidity in Scientific Research. Journal of Cell Science 121, 1771. ↵
- Rohrer, J.M., Egloff, B. & Schmukle, S.C. (2015). Examining the effects of birth order on personality. Proceedings of the National Academy of Sciences of the United States of America. 112(46):14224-14229. ↵
- Griffin, E. & Ledbetter, A., & Sparks, G. (2015). A First Look at Communication Theory (9th edition). New York: McGraw Hill. ↵
