Reframing Assessment
13 Web Mapping Tools and Pedagogical Materials to Support Spatial Thinking
Steven M. Manson, Melinda Kernik, Dudley Bonsal, Laura Matson, Eric Deluca, Ashwini Srinivasamohan and Sophia Strosberg
Keywords
web mapping, computer-aided cartography, experiential learning
Web mapping for spatial thinking
A growing number of disciplines are finding that spatial thinking is a powerful but underexplored mode of inquiry applicable to a range of problems. The last twenty years have seen remarkable growth in spatial technologies, such as digital mapping and earth satellite imaging, along with developments in instructional technology such as computing and web learning. The National Research Council (NRC) report, Learning to Think Spatially (2006), describes the combination of instructional and spatial technology as spatial thinking, an integrator and a facilitator for problem solving across many parts of the curriculum, and one that is predicted to play a significant role in the information-based economy of the coming decades.
Web mapping and geospatial technology more generally offers a way for students and instructors to achieve many key goals of a broader liberal education, meant in the broad sense of both STEM (Science, Technology, Engineering, and Mathematics) and the liberal arts. Web mapping and spatial thinking are entry points into a trillion dollar industry. Billions of people use technologies such as Global Positioning Systems (GPS), Google Maps, Yelp, and Uber. Governments use mapping to identify crime hot-spots, plan social interventions, and identify routes to evacuate vulnerable populations from harm. Companies use spatial analysis to site stores, evaluate supply chains, and determine how much to charge for goods and services. Web mapping is often seen as a way of introducing STEM into a variety of different courses, but it is also an entry point into a classic liberal education that demonstrates specific ways in which creative insights and knowledge are acquired and used, as well as how they change over time. Mapping Our World uses web mapping and cognate technologies examines how scholars use mapping to understand a range of individuals and the social systems of which they are part, along with addressing how technology and society are mutual constitutive.Web mapping is often seen as a way of introducing STEM into a variety of different courses, but it is also an entry point into a classic liberal education that demonstrates specific ways in which creative insights and knowledge are acquired and used, as well as how they change over time.
The NRC report also describes the profound and largely unmet need for approaches to enact spatial thinking in the classroom. People have long used maps, from scratching their worldview on clay tablets thousands of years ago through to people today creating sophisticated web-based maps to change their societies. Mapping is an essential form of inquiry in social science that ranges from the use of geospatial technologies to gather data on people and places through to conducting sophisticated analyses. Mapping also represents the interplay of society and technology as mapping technologies—ranging from the earliest forms of writing to modern satellite imaging and web-based social networks—spring from and play out in a social context. The standard approach in many courses is to use specialized mapping software to explore and analyze spatial data on a range of topics. Application is limited because the software is expensive, entails extensive student and teacher training, and usually requires desktop computers in dedicated computer labs.
As we describe below, a promising avenue for incorporating spatial thinking in the classroom is with web mapping. Web mapping involves using maps over the internet on a mobile device or personal computer. Web mapping promises to require fewer resources than traditional desktop software while replicating much of its functionality. Importantly, web mapping also offers exciting opportunities for creative activities that go beyond standard approaches, freeing spatial thinking from the classroom and encouraging students to creatively engage in the spaces around them in new ways. In the last few years, the capacity of web mapping has gone beyond simple display of pre-existing maps to become, in essence, web-based Geographic Information Systems (GIS) that collect, manipulate, analyze, and visualize spatial data.
Web Mapping in Practice
We focused on developing web mapping technology and curricular material to support spatial thinking. We designed, implemented, and evaluated these materials in Mapping Our World, which enrolls about 300 students per year, and are rolling them out to a broader array of courses. Students who successfully complete this course are able to read, use, and create maps informed by a contextual understanding of how maps reflect the relationship between society and technology and how mapping is an essential form of social science inquiry. Students gain hands-on experience with making their own maps with a variety of technologies, including web-based maps and satellite data, to address a variety of societal issues, such as disaster response and political gerrymandering. The course can be used to gain insight into the technical underpinnings of mapping as a social science approach for later courses, complement on-going interest and activities, or provide an applied focus for research or policy.
In terms of structure, each week centers on a single core theme in mapping. We start with a lecture, online activities on mid-week, and a weekly interactive online laboratory session that students work on all week with several scheduled interactive times (Table 1). In addition, weekly readings and a final lab project build on, and bring together, themes from the entire course as follows:
- Lectures build on the readings to provide the big picture for the week’s activity and lab. Over the course of the semester we cover key skills in mapmaking such as map design symbolization and then move into broader issues such as analysis, lying with maps, and maps in society. Students are encouraged do the readings for each week before the lecture. These readings are on the course website and available for free.
- Activities amplify one or two specific aspects of the week’s topic and are conduced in person and online. Earlier in the semester we focus on making particular styles of maps, while later, we cover topics like how mapping technologies are used to push propaganda and rig elections. In-person activities are conducted in a classroom setting and typically use paper hand-outs. Online activities utilize a mix of small and large group work. Students are automatically assigned to small groups in a learning-management system, Moodle, if the activity that week requires a group. Activities generally start on Wednesday and are usually due on Thursday. We kick off activities during one of several scheduled times where students work as a group with the instructor and other students. Some activities require additional time to complete. For example, some activities require students to spend twenty or thirty minutes doing work and then posting their work to a forum. They then may have to wait a few minutes for someone to respond, and then spend another ten minutes to respond in turn.
- Weekly labs focus on using a range of online tools to explore data, create maps, and understand our world. One week we use mapping technologies to track actual people, for example, while in another we use census data to understand how the Twin Cities have changed over time.
We examine how social scientists use mapping technologies to describe and analyze human experiences and behavior. In addition to learning the fundamentals of mapping, we spend a good deal of time and effort exploring how maps are used in the social sciences, as both tools and objects of analysis. For example, in addition to making their own maps to analyze data, students look at how organizations use maps to tell lies, sell products, win elections, and save lives. In the lectures Analysis and Social maps, for example, we examine how GPS and mapping technologies are designed and used in several contexts, and the discussion includes explicit consideration of multiple social science approaches to understanding social processes. In the labs Simplification and Analysis we examine how researchers use mapping and other approaches to understand social issues such as poverty and income inequality in a broader social context. Most lectures and many activities feature opportunities to discuss and debate a range of issues from a social science perspective. Some are freewheeling, as in the lecture Surveillance when we discuss different theories on how a society should balance privacy and security. Other venues are more structured, as with the lab Tracking people, where students learn to use different methods to examine data on the actual locations of four subjects collected over the course of three days to and describe the subjects’ experiences and behavior.
Students learn how to manipulate primary or secondary data. The first half of the course focuses on the fundamentals of mapping, albeit with constant thread of social elements, while the second half examines the social dimensions of these fundamentals in depth. Mapping relies on a number of basic tasks, from data collection to foundational social science approaches, ranging from mapping data, using symbolization to best represent data, simplifying and classifying data via visual and statistical methods, and then finally analyzing data and maps with a range of methods. We also distinguish between ‘raw’ primary data collected by the analyst and secondary data, or those collected by another party or for another purpose. One week focuses on data, ranging from technical issues of collection to social dimensions such as the changing definition of race and ethnicity in census data over time and what it means for social science analysis. Following weeks examine foundational social science approaches, ranging from how to map these data, use symbolization to best represent these data, simplify and classify these data via visual and statistical methods, and then finally analyze data and maps with methods including analyses of proximity, clustering, and correlation. Later weeks amplify various features of the social science data-analysis workflow developed in the first half of the class, including ways that the same underlying data can be used to develop different narratives and the attendant ethical responsibilities that social scientists must meet.
Table 1: Course structure by week
| Readings/Lecture | Activity | Lab |
| Maps! General overview of maps and their history. | Geospatial revolution. Students watch a video on mapping technologies and answer questions. | Software introduction. Guided tutorial to the web-mapping software. |
| Data. Data types, sources, pitfalls, and uses. | Data scenarios. Students work together to assess a set of land use planning issues and the data needed to understand them. | Mapping data. Mapping basic data and learning about how to find and critique data. |
| Scale + Projection. Mechanics of moving from a 3d world to 2d maps. | Scale and projection. Students work in small groups to assess the utility of different projections. | Scale and projection. Identifying the best scales at which to map certain kinds of data. |
| Symbolization. How are map symbols used and for what purposes? | Bad maps. Groups identify problems with maps | Symbolization. Experimenting with mapping styles and colors. |
| Simplification. Approaches to simplifying and codifying data. | Simplification. Groups classify and map information. | Classification. Learning different ways of sorting and binning data. |
| Analysis. Basic approaches to map analysis and examples of how they are used. | Analysis. Students assess ways of solving mapping problems | Maps in the wild. Students find and share maps from real-world settings. |
| Lying maps. Ways in which maps are used for advertising, propaganda, and other uses. | Gerrymandering. Students complete an online exercise to gerrymander political districts. | Lying maps. Students developed different story lines with the same underlying data. |
| Surveillance. Exploring how mapping and other spatial technologies are used to spy on people. | Surveillance scenarios. Groups discuss campus-based surveillance scenarios. | Tracking people. Students use mapping to track people in time and space. |
| Social maps. How are maps used in society? | Where 2.0. Students watch and discuss videos on mapping and geospatial technology. | Crowd sourcing. Students crowd-source a map of cameras on campus. |
| Project work. Students develop a final project. | Project work. Students work in small groups to refine their project ideas. | Final project. Develop two or three maps for the final project. |
In addition to making their own maps to analyze data, students look at how organizations use maps to tell lies, sell products, win elections, and save lives.We identify key mapping resources and evaluate their quality. We examine the social science dimensions of data and mapping technologies in order to better understand their promises and pitfalls. In the lecture Data, for example, we examine how the Global Positioning System (GPS) works and the limitations of its functionality. We discuss the extent to which users, including social scientists, must deal with the limitations of these and related data such as those collected by satellite imaging. In the lecture Social maps and attendant lab Crowd sourcing, we examine how crowd sourced maps (i.e., those where the public provide the data) compare to more traditional data sources in their accuracy and adaptability, and discuss how these different methods of gathering mapped data affect the way these maps are used. More broadly, over the course of the semester we discuss the role of various individuals and organizations in providing map-based social science analyses, including assessments of data quality, on a range of issues.
Mapping Our World offers multiple instances for students to use mapping to examine the roles that individuals play in their cultural, social, economic, and political worlds.
The course uses mapping as a tool to examine interrelationships among individuals, institutions, structures, events, ideas, and technology. In Social maps, we examine the social and technical dimensions of how mapping technologies such as satellite imaging of the earth, GPS units, or the spatially-aware internet owe their existence and continued evolution to military research. We discuss how mapping is a trillion-dollar enterprise that fuses fast-evolving technologies together with rapidly changing societal practices. We examine the social and technical dimensions of mapping. For example, what are the implications for individuals and society of the fact that private companies, and not governments, are now the largest collectors of spatial data on people and places? In the lecture Data and its attendant activity Data scenarios, for example, we examine these implications for individuals and society in a variety of ways. In the lecture Maps! and activity Geospatial revolution, we take the long view on myriad interrelationships among individuals, institutions, and events by examining how mapping has been used as a tool for, and served as an expression of, social goals such as exploration and contestation of ideas around sovereignty and colonialism.
Mapping Our World offers multiple instances for students to use mapping to examine the roles that individuals play in their cultural, social, economic, and political worlds. We ask questions in the week Surveillance about what surveillance practices mean for individuals and society. What does it mean that most mobile phones and many web-applications like Facebook can track location in a way that was not possible just a few years ago? The Social maps week similarly asks students to consider how they as individuals can take advantage of the ubiquity of both web-based and mobile mapping technologies to change the way we understand and relate to the world. We also examine, in weeks led off by the lectures on Simplification and Symbolization and their accompanying labs, how individuals and organizations make many choices in how the make maps, and how these choices reflect their cultural, social, economic, and political worlds.
Students enjoyed becoming creators and producers of their own data and maps. During the final project period of the course, students spend two weeks developing an astounding array of data and maps on topics from national sports teams to race and ethnicity to urban renewal to environmental change. These problems are often “ill-structured problems” that require discovering multiple forms of data (including developing their own) and reconciling different perspectives. The students critically evaluate the problem, sift through multiple solutions, and then apply technology to develop new views on the world. Interactive mapping, for example, allows students to engage in digital storytelling and adaptive learning, such as through use of dynamic ‘story maps’ that have students describe and analyze real-world problems like climate change or poverty.
Mapping offers a multidisciplinary framework with which to understand a range of local, national, and global issues by engaging in a process of critical evaluation of maps produced by various social groups and researchers. Students develop a framework with which to evaluate the truth claims about a range of local, national, and global issues by engaging in a process of critical evaluation of maps produced by various social groups and researchers. In several activities and most labs, students create their own maps and experiment with different technologies of map creation while examining how different fields—among them anthropology, geography, philosophy, political science, sociology, statistics, and women’s studies—develop a view on the social world. Other engagements are more abstract, as when we examine how mapping is used in fields such as advertising or international relations. In Lying maps, for example, we look at propaganda over the last hundred years, while in the lecture Surveillance, we deal with how social sciences engage with issues of territory and territoriality in the post 9-11 era. We also examine the politics around mapping and how social issues such as immigration or political issues around elections must be synthesized and analyzed at local, national, and global scales.
Mapping Our World employs several strategies to help students to work collaboratively and individually to construct new knowledge. Over half of the activities and all the labs have students use software to create new data, maps, and analyses. While the labs are done individually, in the activities students collaborative to create new knowledge. Students work in small groups of three to ten students to tackle a range of problems. Several activities involve students working together to develop a new and hopefully better understanding of the world, such as finding different ways gerrymandering is done in the real world or how scale and projection can be used to create differing conceptions of issues such as poverty, income, ethnicity, or migration. In another activity, Maps in the wild, students find a map online or in another parts of the public sphere and then analyze the map. Other students in turn provide feedback on the map and the attendant analysis. The final two labs together constitute the final project, which is an opportunity for students to use the many approaches from this class to dive deep into a single problem or issue.
In addition having focusing on mapping as a social science approach, Mapping Our World focuses on how mapping technologies affect and are affected by society in very specific ways and help introduce students to core STEM methods and concepts. We examine the measurable impacts mapping technologies have on society. In the lectures Maps! and Analysis we discuss how mapping is a trillion-dollar enterprise that fuses fast-evolving technologies and with rapidly changing societal practices. We ask questions in Surveillance about what it means for individuals and society that most mobile phones and many web-applications like Facebook can track location in a way that was not possible just a few years ago. Should the government to track our every movement? Should parents or schools track their children? Companies their employees or customers? We examine how these are not hypothetical questions given that tens of millions of people are being tracked at any given moment, including most people in the class. The Social maps week similarly asks students to consider how the ubiquity of both web-based and mobile mapping technologies has impacted the way we understand and relate to the world.
Throughout the course, we discuss the role that society has played in fostering the development of mapping technology….We examine how various social groups put mapping technologies to use.
We examine the science and engineering behind mapping technologies in order to better understand their promise and pitfalls. In the lecture Data, for example, we examine how the Global Positioning System (GPS) works and the limitations of its functionality. Perhaps more importantly, we discuss the extent to which limitations are made clear to its users, and pitfalls these users face as a result of not knowing these limitations. In the lab Tracking people, for example, we examine how the specifics of GPS technology play out in following people in real-world situations, such as the transition from indoors to outdoors or how GPS deals with different modes of travel. We look at similar issues around the basic science and engineering behind the technology behind collecting data from space-borne platforms, drones, and ground based cameras in many of the readings as well as the Data, Analysis, and Surveillance lectures; activities including Data and Scale and projection; and several labs.
Throughout the course, we discuss the role that society has played in fostering the development of mapping technology. In the lectures Maps! and Data, we examine the long-standing impact that society has had on developing mapping technologies, ranging from the impact of the printing press on paper maps to development of computers and satellites on digital mapping. In these lectures and in Social maps, we examine the social and technical dimensions of the fact that mapping technologies such as satellite imaging of the earth, GPS units, or the spatially-aware internet owe their existence and continued evolution to military research. We also examine how mapping practices and related technologies, such as the use of Google map for searching for businesses, are actually shaping our world in many subtle and not-so-subtle ways. In the lecture Data and attendant activity Mapping data, we examine the implications for individuals and society that private companies, and not governments, are now the largest collectors of spatial data about people and places. In Scale and projection, we examine how the basic features of online maps, chosen by the companies that maintain them, have may have unintended affects how readers view the world.
We examine how various social groups put mapping technologies to use. We spend a good deal of time and effort exploring how maps are used in many ways, including to tell lies, sell products, win elections, and save lives. In the lectures Social maps, for example, we watch a video that describes how GPS and mapping technology are designed and used in several contexts, and the discussion includes explicit consideration of multiple perspectives on the same technologies. In Lying maps, we examined how many different cartographic methods can be used to bend the truth, sell a specific perspective, or simply lie about the state of the world. We look at mapping from multiple perspectives, hearing from developers of technology through to users and other people affected by the technology. In several readings and lectures, we also look mapping and geospatial technologies from the perspectives of application developers and mapping companies through to users such as real estate agents and police officers as well as members of the general public.
We develop a framework with which to evaluate new technology now and into the future by engaging in a process of critical evaluation of maps produced by various social groups, along with several conversations around how to critically evaluate how these technologies play out in, and are affected by, a social context. Asking and answering questions with no easy answers gives us the opportunity to develop skills in evaluating conflicting views on existing and emerging features of mapping technology. In several of the labs – including Mapping data, Scale and projection, Symbolization, and Analysis – students create their own maps and experiment with different technologies of map creation. In other labs and activities – such as Gerrymandering, Surveillance scenarios, and Tracking people – we step through questions necessary to understanding the ethical dilemmas posed by situations such as security camera surveillance, crime mapping, and gerrymandering electoral districts. Mapping Our World offers a lens through which to understand interactions between society and technology, as mapping technologies are driven by social imperatives and these technologies in turn change with society.
Lessons Learned
We assessed different web-mapping platforms to identify their visualization and analysis capacity and associated data. We examined how these platforms meet pedagogical needs (after Manson et al. 2014). The University of Minnesota’s spatial science infrastructure, U-Spatial, provides staff, hardware, and software for web mapping and integration with UMN’s broader computing ecosystem, such as x.500 authentication (see http://uspatial.umn.edu). We elected to use two robust platforms, Esri ArcGIS Online and Social Explorer, to develop exercises and online material.
- ArcGIS Online is similar to Google Maps but offers many more advantages because we work with educators to identify features necessary for instruction (Figure 1). Key among these features is a broad range of data, interactivity, security, ease of use, customization, analytical capabilities, low resource demands, and sustainability.
- Social Explorer is a demographic data visualization and research website that allows users to develop dynamic maps and customizable reports (Figure 2).
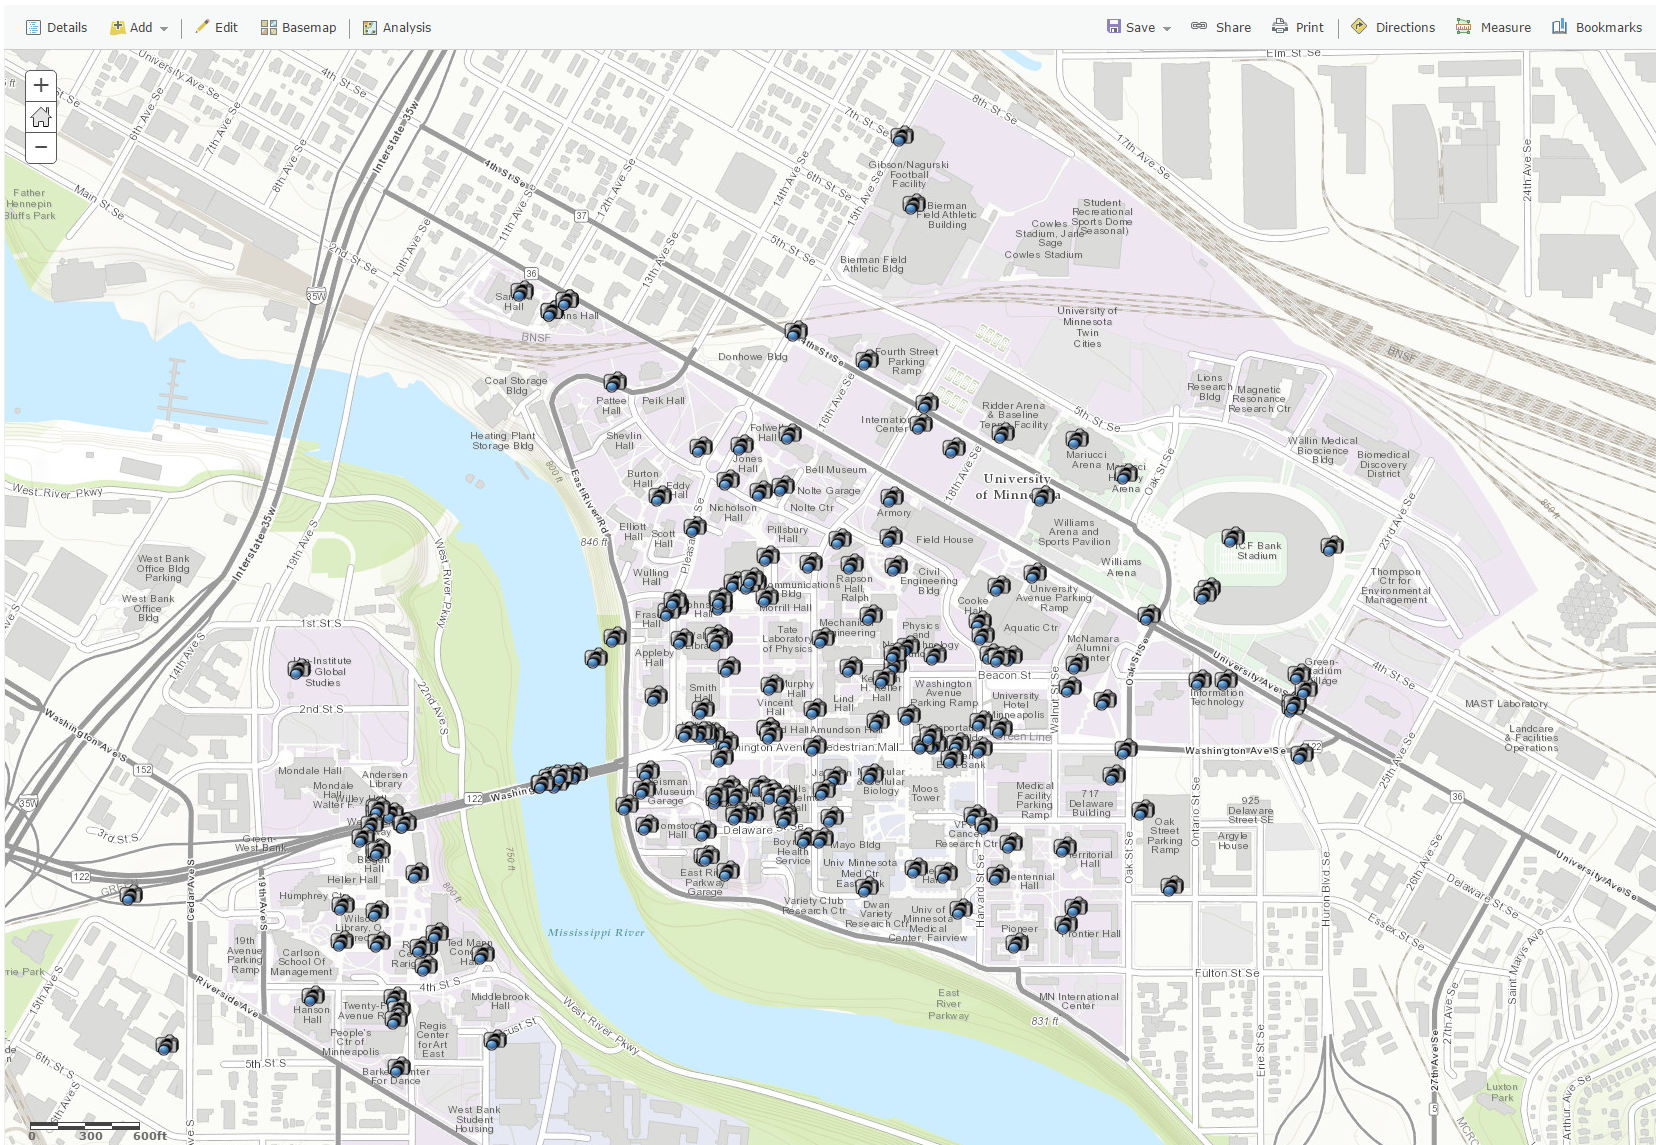
Figure 1: ArcGIS Online map in which students have collaboratively identified and mapped the locations of surveillance cameras
We tested web mapping in the classroom and could draw on the fact that U-Spatial implemented a web-mapping system for campus. First, we have tested web-based activities over the last three years with the 300 students annually who take Geography 1502: Mapping Our World. Second, U-Spatial manages ArcGIS Online for the university, making it available for research use (Harvey 2013). U-Spatial was invited to present on emerging best practices for ArcGIS Online use and management at Esri’s Education Conference (where Esri is the company that makes ArcGIS Online), and U-Spatial was called on to meet with its lead developers to discuss issues specific to higher education.
In addition to examining and testing underlying web-mapping platforms, we expanded and refined curricular material. In addition to creating material for standard spatial-thinking activities, such as cartographic guides, we took advantage of the unique opportunities web mapping offers spatial thinking. This included making exercises for flipped classrooms in which students engage in self-guided work, such as mapping the location of security cameras on campus (Figure 1) and then analyzing and interpreting these data in class as part of a larger discussion about spatial aspects of privacy and security in the digital age. These curricular materials also leverage interactive mapping to allow students to engage in digital storytelling and adaptive learning, such as through use of dynamic ‘story maps’ that have students describe and analyze real-world problems like climate change or poverty. We implemented and tested new technology and pedagogical materials in Mapping Our World. We used student and instructor assessments via surveys, focus groups, and interviews as described below.
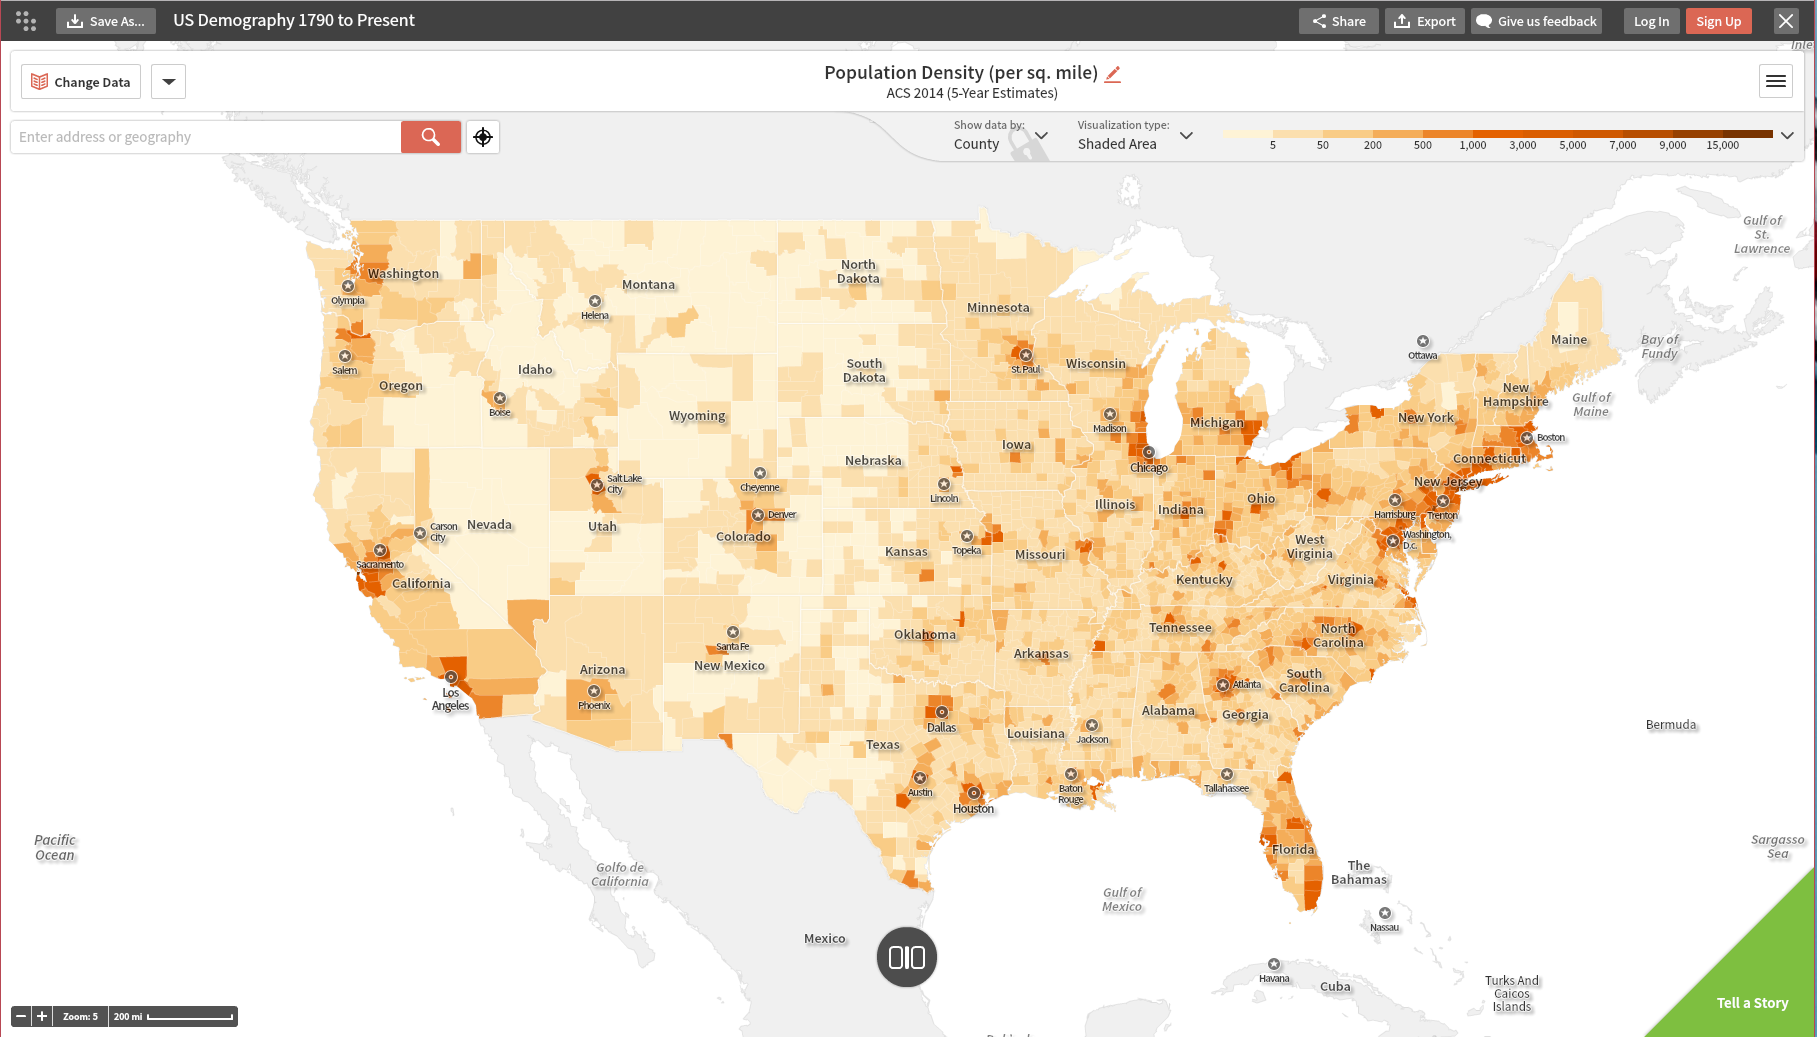
Figure 2: Social Explorer offers mapping and visualization capability for census data.
We tested web mapping in the classroom and could draw on the fact that U-Spatial implemented a web-mapping system for campus. First, we have tested web-based activities over the last three years with the 300 students annually who take Geography 1502: Mapping Our World. Second, U-Spatial manages ArcGIS Online for the university, making it available for research use (Harvey 2013). U-Spatial was invited to present on emerging best practices for ArcGIS Online use and management at Esri’s Education Conference (where Esri is the company that makes ArcGIS Online), and U-Spatial was called on to meet with its lead developers to discuss issues specific to higher education.
In addition to examining and testing underlying web-mapping platforms, we expanded and refined curricular material. In addition to creating material for standard spatial-thinking activities, such as cartographic guides, we took advantage of the unique opportunities web mapping offers spatial thinking. This included making exercises for flipped classrooms in which students engage in self-guided work, such as mapping the location of security cameras on campus (Figure 1) and then analyzing and interpreting these data in class as part of a larger discussion about spatial aspects of privacy and security in the digital age. These curricular materials also leverage interactive mapping to allow students to engage in digital storytelling and adaptive learning, such as through use of dynamic ‘story maps’ that have students describe and analyze real-world problems like climate change or poverty. We implemented and tested new technology and pedagogical materials in Mapping Our World. We used student and instructor assessments via surveys, focus groups, and interviews as described below.
Table 2: Web mapping responses coded by sentiment (n = 104)
| Questions with coded responses | Students(%) |
| What do you like best about the web mapping applications used in class? | |
| Easy and/or quick to use | 55 |
| Ability to analyze and visualize spatial data with a range of tools | 28 |
| Ability to customize map appearance an/or purpose | 25 |
| Large amounts of data available online | 15 |
| Generally enjoyable or useful | 13 |
| Free access to an online interface | 12 |
| Educates about how mapping works | 10 |
| Being able to compare different data sets/interoperability | 4 |
| What is one thing you would change about the web mapping applications used in class? | |
| Occasional software glitches | 31 |
| Software can be confusing at times | 28 |
| Allow for more customization or have more features | 22 |
| Difficult to find data in online catalogs | 27 |
| Nothing | 20 |
| More hands-on software instruction | 12 |
| Better quality datasets and metadata | 10 |
| More opportunities to develop paper maps by hand | 4 |
Students like web mapping but there is room to improve instructional materials on the systems themselves. Survey responses across offerings indicate students generally enjoy the mapping experience (Table 2). They enjoy web mapping because it is quick and easy, allows them to do interesting things, and they can customize the experience among other reasons.
Beyond a few technical issues, one drawback is that a sizable minority of students expressed interest in more instruction with the web mapping tools before using them for assignments. We are planning to develop more, and better, guides and tutorials. We are also working with the creators of these web-based tools to identify areas where they can provide online tutorials and other materials what can help train students. Finally, we have developed several tutorials that focus on areas where students have problems (e.g., finding specific types of mapping tools on a site) as well as expanded documentation on the labs themselves.
In addition to students finding web mapping useful, the large majority valued the online materials, including a draft version of an online textbook for the course. The U of M Libraries conducted a survey on these materials and student responses included the following open-ended responses. All students surveyed replied ‘yes’ to the question “would you take another course using material like this?” Common answers to the question “what worked well for you when using the digital course material?” included that they were free, easy to access, well organized, easy to use, accessible any time, and tied well to the course content. Most students reported no concerns, although two commented that it would have been more convenient to have paper copies of the reading when they there was no internet access (e.g., it becomes unavailable at home).
Table 3 offers insight into the mostly positive experience students have in using the free course content assigned for this class. The sample size in this survey is smaller than the survey described by Table 2 because it was administered closer to the end of the semester and, unlike that above, was not assigned course credit.
In addition to high-levels of student satisfaction, we found a number of advantages for instructors, who can develop innovate assignments for which students can make creative solutions because the system offers several key characteristics. Among these are:
- Analysis. Both applications, ArcGIS in particular, offer sophisticated visualization and analysis tools that are usually found only in specialized and difficult-to-learn workstation software. Students can add, edit, manipulate, and analyze data.
- Data. ArcGIS Online has data ranging from census information and street networks to protected wetlands and remotely sensed imagery. While an instructor can focus on particular kinds of data, students can also easily gain access to literally thousands of datasets encompassing a wide array of human and environmental topics.
- Low Resource Demands. Our experience points to mapping capacity that requires fewer hardware and software resources than full-fledged mapping or GIS software, which often requires expensive dedicated hardware and much time to learn basics. Learning the rudiments of ArcGIS Desktop, for example, requires a four-credit course in a specialized lab. In contrast, web mapping is easy to pick up and can be used on any computer with an internet connection; students and instructors with no mapping experience can learn ArcGIS Online or Social Explorer in about twenty minutes on pretty much any computer. As above, one challenge is that a minority of students report some problems with learning the software, but judging from the queries we get in office hours, these problems tend to be very short-term and specific instances, and we are developing materials to address this issue. More broadly, students and instructors can engage in a broader array of activities because they are not tied down to a physical lab or constrained to using software on campus due to licensing.
- Interactivity. Tools to allow students and faculty to upload their own data via onscreen digitizing, global positioning system (GPS) handsets, or third-party digital maps available over the internet. This includes uploading and searching for images, video, audio, and other data. This range allows students to develop innovative solutions to a range of problems posed by assignments and meeting their own interests.
- Sustainability. Web mapping can be sustainable through various strategies, but of particular emphasis at the University of Minnesota is the existence of Enterprise GIS (a division of U Services that supports enterprise-scale geographical information system support) and U-Spatial to administer and maintain ArcGIS Online in the long term. The platform is part of the larger ArcGIS family of GIS software for which the university has site license, which means instructors can get full-time technical support. Overall, the project is sustainable by virtue of having low resource demands, as noted above, making it more likely to be adopted and funded by a range of actors on campus.
Table 3. Responses to the question: Based on your experience using the free/affordable course content assigned for this class, rank the following statements (n = 24)
| Question | Strongly Disagree | Disagree | Neutral | Agree | Strongly Agree |
| The materials for this class were easy to use | 0 | 0 | 0 | 10 | 14 |
| The materials for this class were easy to access | 0 | 0 | 0 | 10 | 14 |
| The resources covered material in a way that I understood | 0 | 0 | 1 | 9 | 14 |
| I read more of the assigned readings because the materials were free | 0 | 0 | 3 | 8 | 13 |
| I read more of the assigned readings because they were available online | 0 | 1 | 1 | 9 | 13 |
| I studied using the online readings/videos | 0 | 2 | 0 | 9 | 13 |
Future Directions
In addition to expanding our guides and material around basis map use, we would like to work with instructors who have asked U-Spatial for help in enacting spatial thinking in their courses. This outreach has potential for high impact because it encourages spatial thinking in the hundreds of students from dozens of departments who take Mapping Our World, but it has even greater potential (and meets correspondingly low resistance) by satisfying broad faculty interest in spatial thinking on campus.
Now is an ideal time to extend the use of web-mapping to classrooms all across campus. Over 2000 staff, faculty, and students at the university already use ArcGIS for research use. Many of these scholars, and others besides, have expressed interest in using the system for teaching purposes. In response to this demand, and in order to take advantage of existing web mapping infrastructure, U-Spatial will provide the backend technical infrastructure and support, while other groups such as ourselves will engage in several activities to bring ArcGIS Online to teaching. We are working on: 1) readying ArcGIS Online for broader classroom adoption, such as integration with Moodle and offering several simple interfaces; 2) writing curricular templates and how-to guides and generic labs that can be adapted by any instructor; and 3) working with CLA faculty for the first year to roll-out ArcGIS Online and these curricular templates in the classroom.
References
Harvey, F., Kne, L., & Manson, S. (2013). U-Spatial: A Consortium for the Spatial University. ESRI, Redlands.
Manson, S., Shannon, J., Eria, S., Kne, L., Dyke, K., Nelson, S., … & Matson, L. (2014). Resource Needs and Pedagogical Value of Web Mapping for Spatial Thinking. Journal of Geography, 113(3), 107-117.
National Research Council (US). Committee on Support for Thinking Spatially (2006). Learning to Think Spatially. National Academies Press.
Acknowledgements
Developing spatial thinking materials require a team-based approach. Steven Manson is a mapping researcher and the primary instructor of Mapping Our World, the course in which we developed material. Len Kne is the Associate Director of U-Spatial, U of M’s spatial technology infrastructure and leads its web mapping team. Eric DeLuca, Melinda Kernik, Laura Matson, Ashwini Srinivasamohan, and Sophia Strosberg collectively served twelve semesters as teaching assistants for Mapping Our World and were integral to designing and implementing web mapping technology in the classroom. Paul Ching, from the Center for Educational Innovation, and Susan Tade, from Academic Technology Support Services, are experts in pedagogy and technology and provided advice and guidance at all steps along the way. Kristi Jensen and Shane Nackerud from the eLearning Support Initiative of the University Libraries offered expertise on copyright, elearning, and information technology with support from the Partnership for Affordable Content program.
